
Monday hits at 9:05 a.m. and your phones light up all at once. Two agents are already on calls, one is wrapping up notes, and the fourth hasn't logged in yet. A billing question lands with tech support, a repeat caller explains the same problem for the third time, and by 9:30 someone has hung up after waiting on hold.
That mess isn't usually a people problem. It's a contact center management problem, where routing, staffing, handle time and follow-up work as one connected system. Fix one piece in isolation and you'll often make another piece worse. Fix the connections between them and a small team can handle peak hours without burning out or rushing callers off the line.
What Contact Center Management Covers
Contact center management decides which calls reach which agents, in what order, and how many people stay on the phones when volume jumps. Agents talk to customers. Management runs the people, routing rules, tools, and measurements around those conversations so each caller reaches someone who can finish the job.
One call still passes the same six functions, whether you have five agents or five hundred. It arrives. A system greets it and sorts it. An agent with the right skill answers. After the hang-up, someone checks whether the problem stayed solved. Skip a step and the caller feels it, even when every agent worked hard.
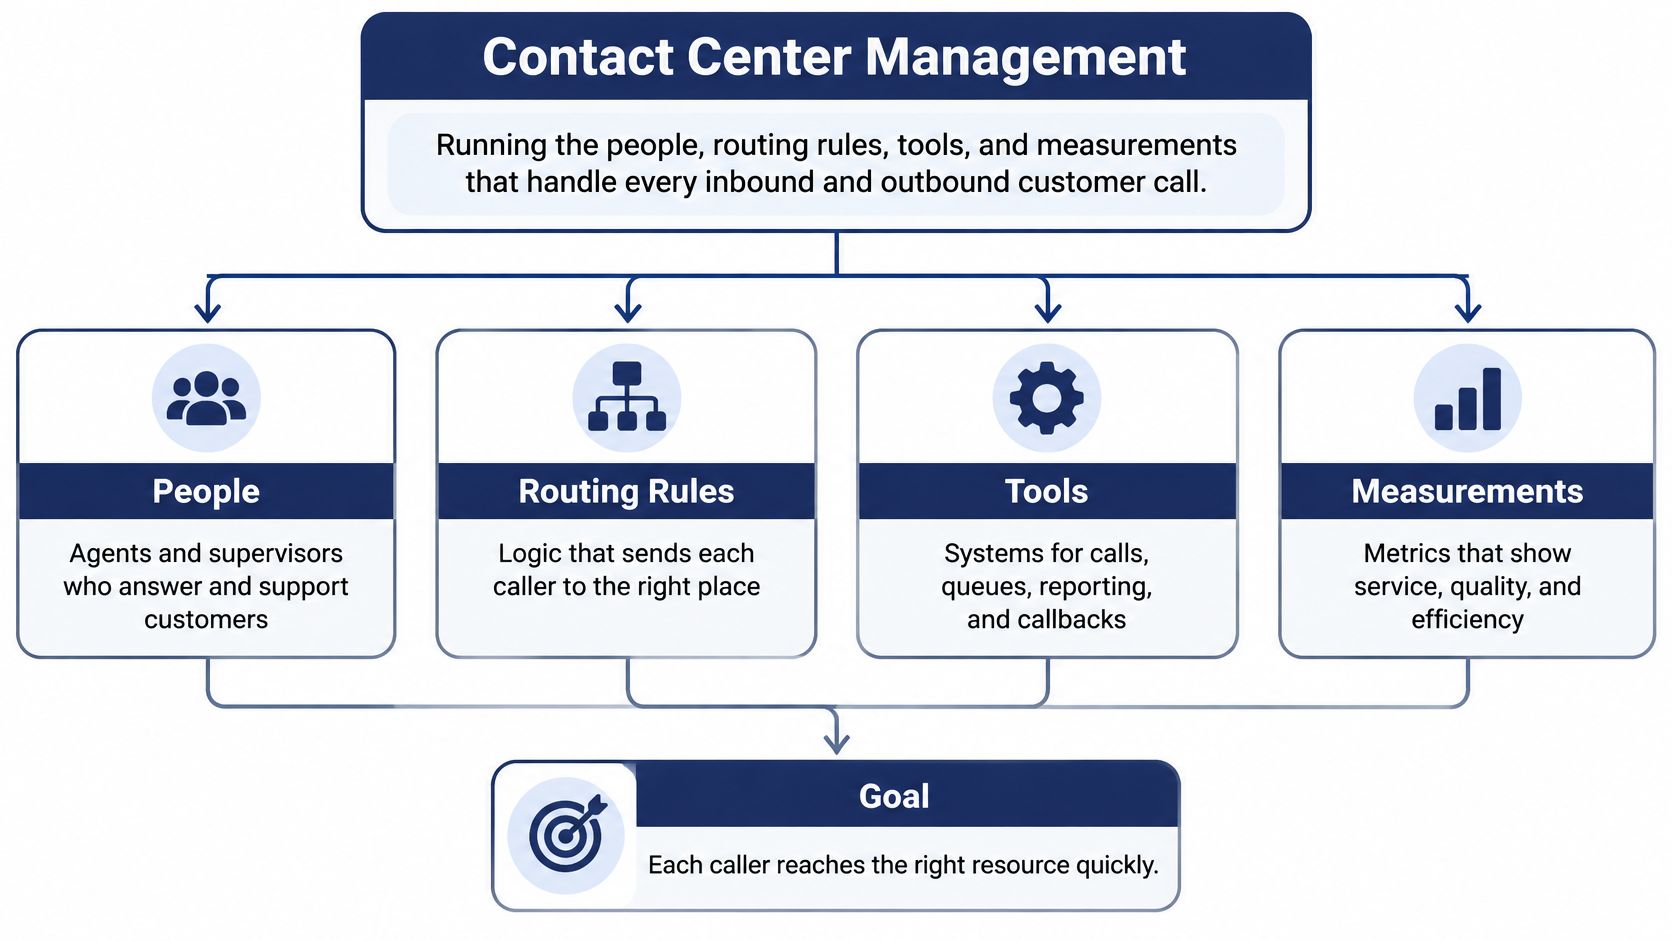
The Six Functions in the Order a Call Meets Them
- Call handling: Your IVR, queues, and routing rules decide the first stop. A short menu and skill-based routing matter more than a polished greeting. Callbacks sit in this same decision: during a surge, a return call can cut abandoned calls without seating an agent for every peak minute.
- Workforce planning: Forecasting and scheduling decide whether anyone is free. Perfect routing cannot save an empty hour. On some queues, one extra person during the rush costs less than the callbacks, refunds, and repeat contacts that hour creates.
- Performance measurement: KPIs show whether callers waited, hung up, or had to call back. Without them you manage by whoever complained loudest.
- Quality and coaching: Listening to calls and coaching agents turns scores into better conversations. A longer call that resolves the issue often costs less than a short one that forces a second contact.
- Technology: Your cloud PBX, reporting, and recording tools carry the routing, store the data, and show the queue while it is happening.
- Compliance: Recording disclosures, payment handling, and access controls keep the operation legal and trustworthy. Those rules have to match how you route, staff, and coach, or a "faster" process creates a risk you only find later.
Customer service remains a large occupation with steady replacement hiring, even when total employment is projected to shrink. The Bureau of Labor Statistics customer service representatives outlook tracks current job counts, openings, and the employment projection. For a small team, that turnover still puts recruiting, onboarding, coaching, and scheduling on the same manager's week.
A team of 5 to 30 agents runs the same six functions as a 500-seat center. You just have fewer people per function, so one supervisor often covers scheduling and coaching on the same day.
Small teams break at the seams first. The person who builds the schedule may never hear the calls that prove it is wrong. The owner who pushes handle time down may miss the repeat contacts one extra minute would have stopped. Staffing, handle time, callbacks, and compliance pay off only as one system. I would rather run a slightly longer call and one extra person on a bad hour than save both and pay for the same customer twice.
Core KPIs and Targets to Track
Start with the table, then learn to read it as three stories about access, experience and efficiency. If you want a deeper breakdown of formulas and dashboards, our guide to call center KPIs walks through how each measure is calculated. Treat every target below as a starting point you'll adjust by industry, call type and channel.
| KPI | What it measures | Starting target |
|---|---|---|
| Service level | Share of calls answered within a target time, such as 20 seconds | 80/20 as a starting point |
| Average speed of answer | Average wait before an agent picks up | Under 30 seconds |
| Abandonment rate | Calls abandoned divided by calls offered | Under 5 percent |
| First-contact resolution | Issues resolved on the first contact divided by total contacts | Track the trend; set a goal per call type |
| Average handle time | Talk, hold and after-call work per call | Set per call type, not one center-wide target |
| Occupancy | Handle time divided by logged-in time | 75 to 85 percent |
| Repeat-contact rate | Same customer and same issue within 7 days, divided by total contacts | Lower is better; track by intent |
| Customer satisfaction (CSAT) | Average post-call survey score | Record a baseline first, then improve |
| Forecast accuracy | Forecast versus actual workload, measured as WAPE | Set per channel and interval; errors of 10 to 12 percent are common |
Access Comes First
Service level and average speed of answer tell you whether callers can reach you at all. A service level of 80/20 means 80 percent of calls are answered within 20 seconds. Say you hit 80/20 for the day but miss badly between 9 and 10 a.m. Your daily number looks fine while your busiest callers suffered, so always read these two by interval, not just by day.
Experience Tells You Whether Access Was Worth It
Abandonment above 5 percent in a single hour usually signals a staffing gap, not a training gap. Agents can't answer calls that arrive faster than they can finish them. Pair abandonment with first-contact resolution, repeat-contact rate and CSAT. For example, if billing calls resolve quickly but the same customers return within a week, your agents are closing calls without closing issues. CSAT then confirms whether customers felt the difference.
Efficiency Keeps the System Honest
Average handle time, occupancy and forecast accuracy show what access costs you. Occupancy above about 85 percent tends to cause burnout and longer queues because agents get no slack between calls to finish notes or breathe. Push occupancy toward 100 percent on paper and you'll pay for it in errors, sick days and turnover. Forecast accuracy is the lever behind both, and moving reporting into cloud tools helps here, one reason many small firms weigh cloud computing benefits for SMEs when they replace manual spreadsheets with live dashboards.
I would start a small team on five measures only: service level, abandonment, first-contact resolution, occupancy and CSAT. Pull those five every Monday, compare them against the previous four weeks, and flag any interval where a number drifted more than 10 percent. That weekly routine catches problems while they're still cheap to fix.
How IVR, Queues and Callbacks Route Each Call
Routing decides a call's fate before an agent says hello. The diagram below shows the path a caller takes from first ring to agent, and it's worth tracing with your own phone before you change anything.
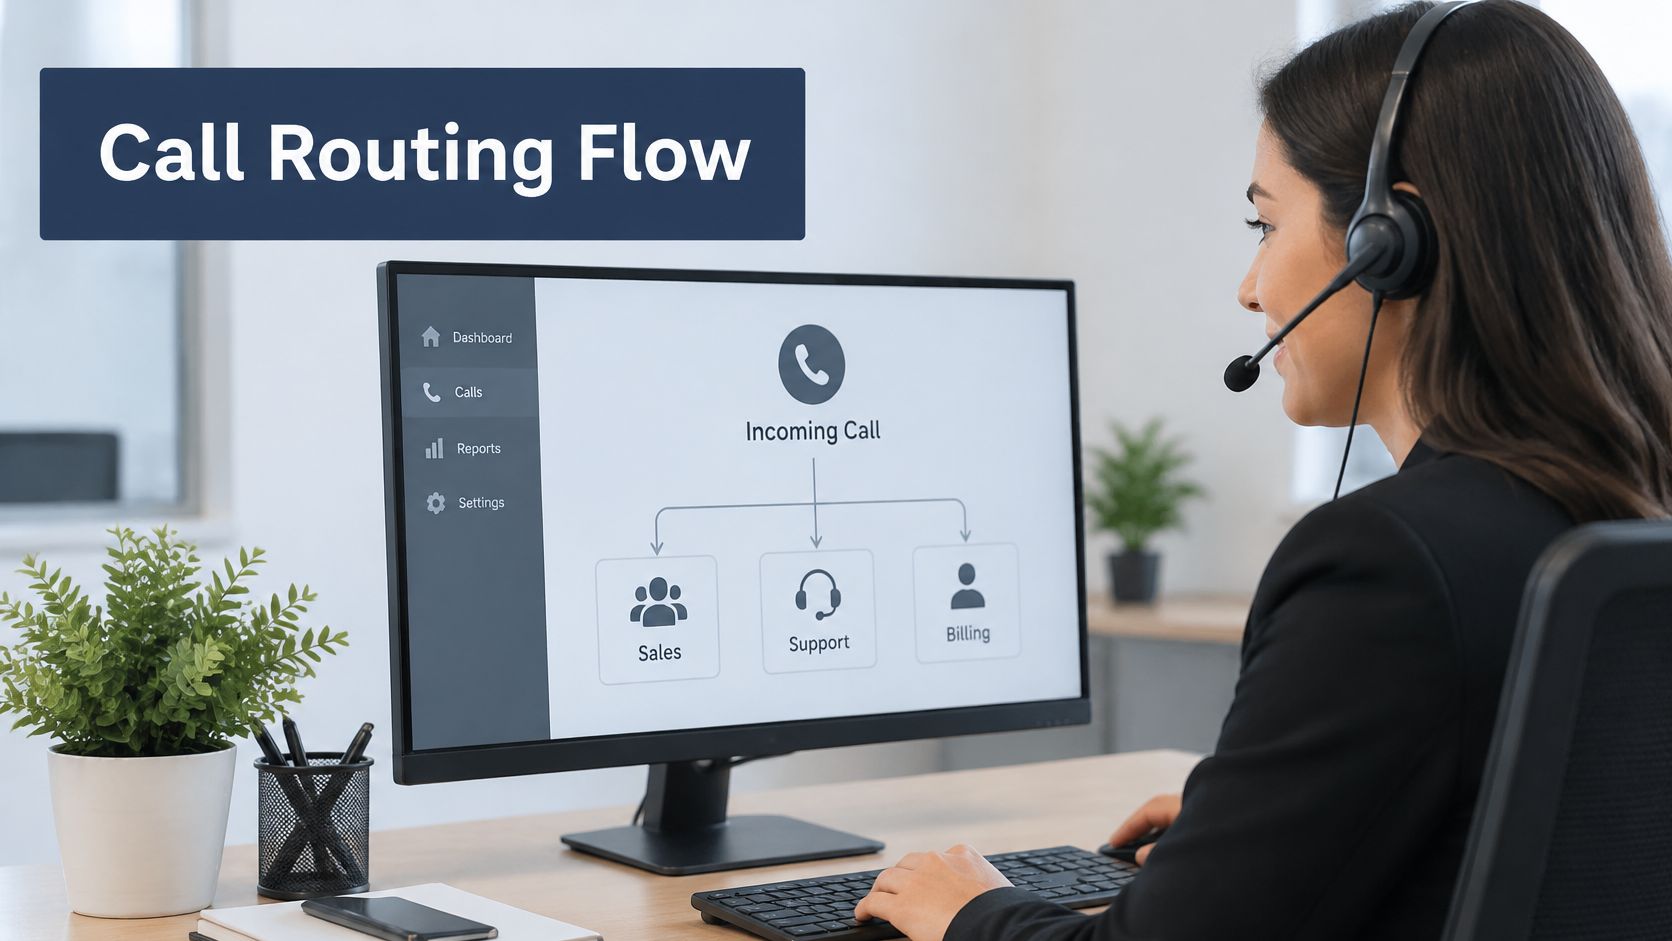
One Call From Ring to Agent
- The IVR greets the caller and offers a short menu, for example press 1 for billing and 2 for technical support. The menu's job is sorting, not marketing.
- Skill-based routing sends the call to agents who hold that skill. A billing-trained agent shouldn't guess at a network fault.
- The queue holds the call if no agent is free. The caller hears a wait-time announcement and a position estimate, which makes the wait feel known rather than endless.
- Overflow rules move the call after a set wait, such as 90 seconds, to a second team or voicemail. Without overflow, one busy queue traps callers while other agents sit idle.
- Queue callback lets the caller keep their place and receive a call back instead of holding. The caller gets their time back, and your queue gets shorter.
For a plain explanation of routing methods and queue logic, see our overview of how call routing works. The design rules are simple. Keep IVR menus to three levels or fewer, offer a route to an agent at the first menu, and avoid dead ends where callers can't go back. Every extra menu layer costs you callers who press zero, guess, or hang up and try a competitor.
When Callbacks Beat Holding
Callbacks aren't just a courtesy. An empirical study published in Management Science and available through the ACM Digital Library record for the callback study found that offering either a place-holding callback or a callback within a guaranteed time window reduced average on-phone waiting by up to 71% and lowered average waiting-related cost by up to 46%. During temporary congestion, callback demand postponement reduced online waiting by up to 86%, improved service quality by up to 54%, and increased throughput by up to 2.1%.
Use that strength selectively. Trigger callbacks during short-lived overloads, such as the hour after a billing run, rather than as a permanent replacement for queueing. Preserve the caller's queue position, promise a window your team can meet, and monitor callback completion, no-answer, repeat-contact and abandoned-callback rates. The same study found callers experienced three to six times less discomfort per unit of time waiting offline for a callback than remaining on hold, so perceived service improves even when total elapsed time doesn't.
This short video shows how queue and callback settings look from the manager's side before you test them on live callers.
Cloud PBX tools support this flow with smart queue management, queue callbacks, wait-time announcements and real-time queue statistics. Each one changes something specific for the caller. Announcements reduce uncertainty, callbacks return time, and live statistics let a supervisor move an agent between queues before abandonment spikes.
Test one change first. I'd start by adding a callback offer to your busiest queue during its worst hour, because you'll see the effect on abandonment within days.
Forecasting and Staffing Enough Agents
Staffing looks like guesswork in many small centers, but it rests on math that's more than a century old. The Ender Turing history of Erlang's telephone traffic research notes that Danish engineer Agner Krarup Erlang published his study in 1917, producing formulas including Erlang B, which models call blocking when no agents or lines are available, and Erlang C, which models waiting time when callers enter a queue. Managers still use these models to estimate agents required for service-level targets, predict queue delays and balance staffing against occupancy.
The core lesson still holds. You can't plan capacity from average call volume alone, because arrival variability, average handling time, available agents and the probability that all agents are busy all shape the wait. Two hours with identical call totals can feel completely different if one spreads calls evenly and the other dumps them into ten minutes.
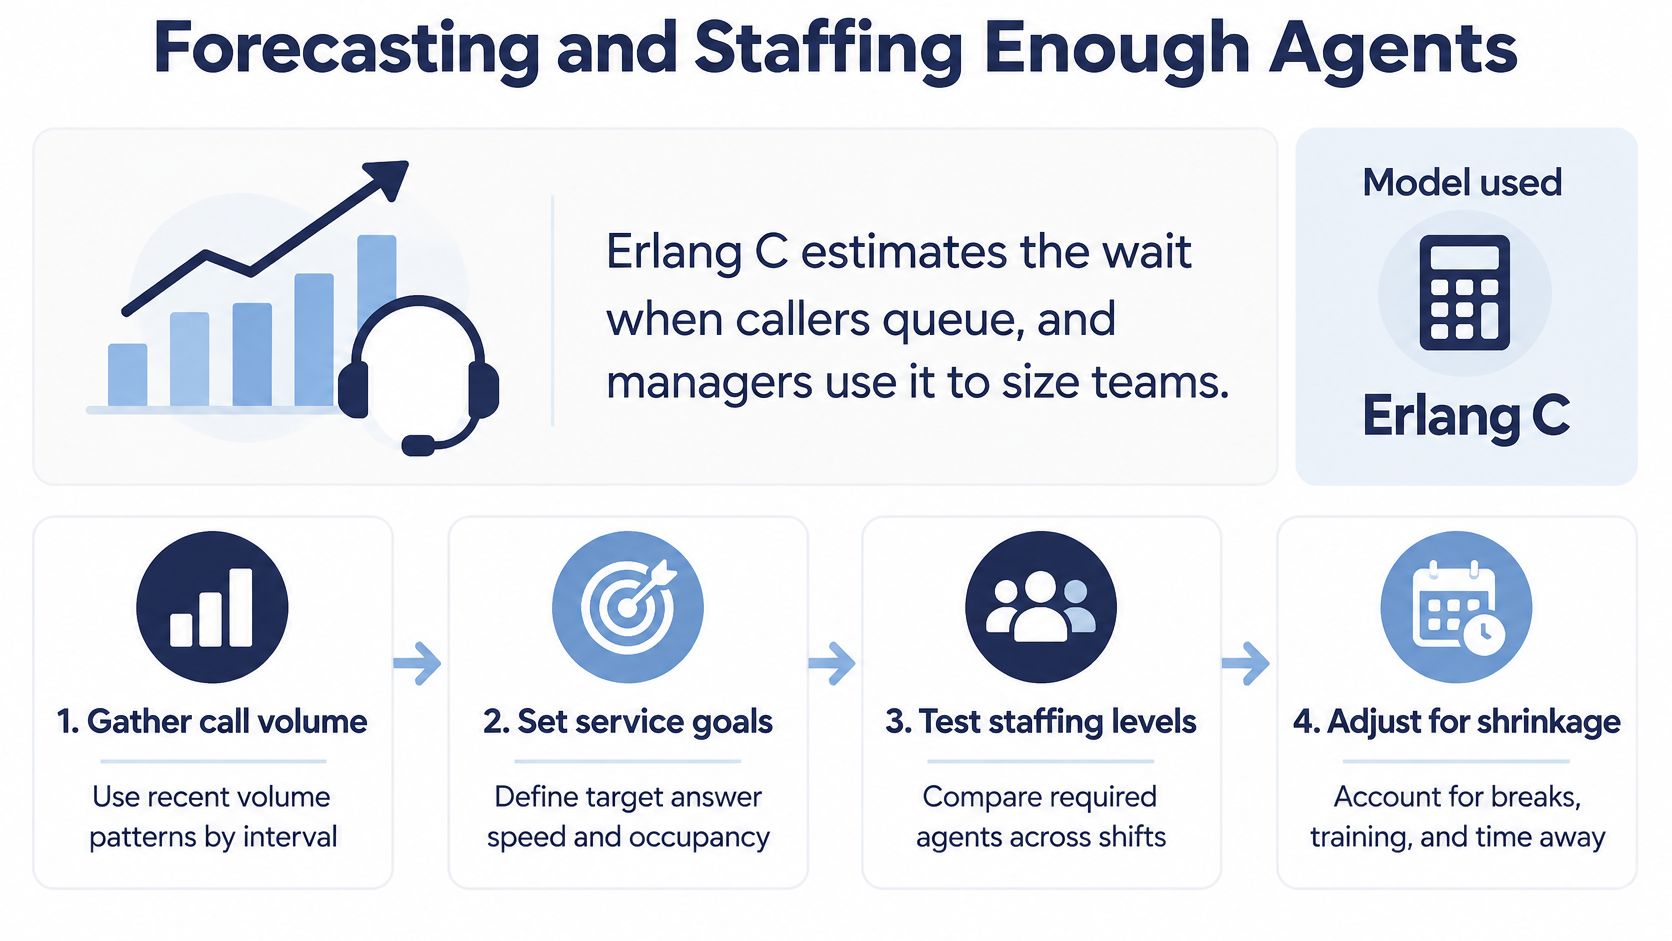
Seven Steps From History to Schedule
- Pull 12 weeks of call volume by 30-minute interval. Twelve weeks smooths out one-off spikes while still reflecting your current demand.
- Measure average handle time for each call type, including after-call work. Talk time alone understates the actual workload.
- Convert volume to workload. Calls per interval multiplied by handle time gives you agent-hours of work that must be covered.
- Add shrinkage for breaks, training, absence and meetings. A planning range of 25 to 35 percent is common in worked examples, and ignoring it guarantees understaffing.
- Use an Erlang C calculator to find the agents needed for your service-level target. The calculator accounts for the probability that a caller waits, which simple division can't.
- Build schedules by interval, not just by day. Ten agents spread evenly won't help if your peak needs fourteen and your afternoon needs six.
- Compare forecast with actual workload every week using WAPE, and reforecast mid-day when a spike arrives. A forecast you never check is just a guess with formatting.
Why Queues Explode Near Full Occupancy
Queues grow sharply as occupancy approaches 100 percent, and the growth isn't linear. When agents run at moderate occupancy, a few extra calls add a short wait. When agents are already saturated, those same extra calls stack up because there's no idle capacity to absorb them, so waits and abandonment jump together.
Planning rule: Forecast error of 10 to 12 percent is normal, so build buffer into the schedule rather than chasing a perfect prediction you'll never hit.
That buffer isn't waste. It's the difference between a busy hour your team absorbs and a busy hour that breaks your service level for the rest of the morning. Understaffing also creates a feedback loop, since rushed agents generate repeat calls that add demand tomorrow.
A Worked Example
Say you receive 120 calls in an hour and each takes 4 minutes including after-call work. That's 480 minutes, or 8 agent-hours of talk and wrap-up time. Apply 30 percent shrinkage and the math becomes 8 divided by 0.7, which is about 11.4. You'd schedule 12 agents for that hour, not 8 by simple division or 10 by gut feel.
Notice what the example teaches. Shrinkage and waiting probability, not raw call count, push the answer from 8 to 12. Run the same math for your worst interval this week and compare it with who showed up. That gap explains most "mystery" abandonment spikes.
Balancing Handle Time With Resolution
Shorter calls aren't automatically better. That claim surprises owners who've treated average handle time as a pure efficiency score, but the math of repeat calls exposes the flaw quickly. Our explainer on average handle time and how to use it covers the formula, and the management question is what you pair it with.
Say a billing call takes 3 minutes because the agent rushes the explanation. The customer calls back the next day and the second call takes 5 minutes, now with frustration added. You've spent about 8 minutes of agent time plus two queue waits, which costs more than one 6-minute call that closed the issue properly. AHT rewarded the first agent and punished the one who would've prevented the repeat.
Why AHT Alone Misleads
AHT can reward rushed interactions, avoidable transfers and repeat contacts because all three shorten the current call while pushing work elsewhere. The Customer Contact Week Digital report on the future of contact centre agents reports that 70% of brands still use AHT as their most common agent-performance measure, while only 48% use voice-of-the-employee programs and 49% use workforce-management tools. When the easiest number to collect becomes the main target, agents learn to protect the number instead of the customer.
A Four-Measure Scorecard for Smaller Centers
Set AHT targets by call type rather than imposing one center-wide number. For example, simple account updates might sit at 3 to 4 minutes while technical troubleshooting needs 10 to 12 minutes. Then judge each type with four measures together:
- AHT by call type: Shows whether time is drifting for a specific intent.
- First-contact resolution: Shows whether the time spent solved the problem.
- Repeat-contact rate within seven days: Catches false resolutions that FCR surveys miss.
- CSAT or customer effort: Shows whether the customer felt helped or hurried.
Longer calls win when the caller is high value, the issue is complex, or the topic is regulated and a complete answer prevents a complaint. In those cases, extra minutes aren't inefficiency. They're insurance against rework, refunds and churn.
Run a simple test. Pick one call type, let agents take the time needed for two weeks, and compare repeat contacts and CSAT with the prior period. Keep the guardrail clear: if AHT rises but repeat contacts fall by more, the change pays off.
Scaling Across Locations With Shared Standards
Scaling fails when each location invents its own greetings, codes and definitions, then argues about whose numbers are right. The principle that works is straightforward. Standardize what customers hear and how results are measured, but let each location own its staffing. Customers get one consistent experience, while local managers keep control of local peaks, sick cover and time-zone realities.
A Seven-Part Sequence for Adding Sites
- Pilot the change at one site before rolling it everywhere. One location proves the routing and scripts work under real calls.
- Standardize the IVR greeting, queue names and call-type codes across sites. Identical labels make reports comparable.
- Decide which calls stay local and which pool centrally. Local knowledge matters for some intents, while password resets can go anywhere.
- Set after-hours and time-zone routing so calls reach an open site instead of voicemail. A caller at 6 p.m. shouldn't care which office is still open.
- Use one reporting view with identical KPI definitions for every location. Two definitions of abandonment will produce two arguments, not insight.
- Create a shared onboarding and coaching playbook so a new hire learns the same standards at any site. Consistency in training shows up as consistency on calls.
- Arrange pooled backup agents for peak hours. Cross-trained staff who can overflow between sites are cheaper than idle capacity at every site.
Why Daily Averages Hide the Failure
A site can hit its daily service level yet miss it every morning from 9 to 11, because strong afternoons average out weak mornings. The NICE 2025 survey of modern contact-center employers reported that mean forecasting projections were typically 10–12% off across channels, and its guidance stresses evaluating accuracy at the interval level because daily averages conceal the staffing failures that create long waits. Managers should compare forecast versus actual workload using a declared measure such as WAPE or MAPE, segmented by channel and interval, then correct with intraday reforecasting.
Say you run three locations. Site B shows 12 percent abandonment between 9 and 11 while site A shows 3 percent in the same window. That isn't a company-wide staffing shortage. It's a routing opportunity, so overflow from site A should cover site B during those two hours before you hire anyone.
Cloud PBX tools make this practical through real-time queue statistics, detailed reporting and overflow rules that span sites. A supervisor can watch interval variance as it develops, adjust routing, and verify the effect against service level, abandonment, occupancy and backlog.
Keep KPI definitions identical across sites, or your comparisons will mislead managers into fixing the wrong location.
Security, Recording and Compliance Basics
Compliance works best as a set of operating rules your team follows daily, not as legal advice you read once. Three risk areas cover most of what a small center must get right: recording consent, payment data and access to recordings. Sector rules such as HIPAA or GDPR add their own duties, and a qualified advisor should confirm how they apply to your business.
Recording, Payments and Access
Recording rules depend on jurisdiction, and some regions require every party to consent. Play a disclosure at the start of recorded calls, keep a written policy agents can point to, and don't assume your home state's rule covers callers elsewhere. If a customer objects, your team needs a clear fallback, such as continuing without recording where your policy allows it.
Payment data needs stricter handling. Don't capture card numbers in recordings or free-text notes. Use pause-and-mask features or a payment tool that keeps card numbers out of your systems entirely, so a leaked recording can't become a card breach.
Retention and access close the loop. Set how long recordings and transcripts are kept and delete them on schedule, because indefinite storage creates risk without adding value. Give each role only the permissions it needs, require multi-factor authentication on admin portals, and review who can download recordings.
Automation adds one more rule. Tell callers when they're talking to a bot and always offer a route to a person. The Qualtrics contact center trends research found that 61% of consumers prefer human channels, and 74% would rather use human channels for issue resolution or technical support. Keep a visible route to an agent in every bot flow, and track whether bot-handled calls end in repeat contacts or complaints.
A Checklist You Can Assign This Week
- Confirm recording rules for every state or country you serve.
- Add a consent announcement to the IVR.
- Set a retention period and delete on schedule.
- Mask card data during payment moments.
- Limit admin rights to named roles.
- Review audit logs each quarter.
Assign each item to one owner with a date. Compliance tasks without owners drift until an incident assigns them for you.
Choose Your First Contact Center Fix
Don't try to fix routing, staffing and handle time in the same month. Pick one gap, match it to one fix, and test it for 30 days with identical definitions before and after.

Start by pulling 30 days of data for the five starter KPIs: service level, abandonment, first-contact resolution, occupancy and CSAT. Find the single largest gap, such as abandonment above 5 percent at peak hours or weak first-contact resolution for one call type. The largest gap, not the most annoying anecdote, decides your first project.
Then match the gap to its fix. Peak-hour abandonment points to interval staffing and callback routing during overloads. A resolution gap points to the four-measure scorecard and letting agents finish complex calls properly. Uneven performance across locations points to overflow rules and pooled backup during the weak site's worst window.
Set one change and a 30-day test window. Compare the same KPIs at the end using the same definitions, intervals and call types. If you change the definition mid-test, you've learned nothing.
Cloud tools make that test runnable without an IT ticket. SnapDial's Call Center features include smart queue management, unlimited IVRs, real-time queue stats, reporting tools, wait time announcements and queue call back, and its Web Portal lets businesses manage voicemails, call logs, call recordings and call routing changes from anywhere. If you get stuck mid-test, our Texas support center is open 24/7 by phone or through its support center.
If the gap is small, improve forecasting before you spend on new tools.
Extra staff and longer calls sometimes look expensive line by line. Measured across the whole system, they often cost less than the abandonment, repeats and turnover they prevent.
Ready to run your first 30-day test with queues, callbacks and live reporting in one place? Visit SnapDial to see how our cloud phone system gives small teams smart queue management, real-time queue stats and a web portal for routing changes. Request a quote or schedule a call, and we'll help you pick the fix your numbers are pointing to.