
Your phones are busy. Customers are waiting. Agents are working hard. Yet when you ask simple management questions, the answers are fuzzy.
Why are calls spiking on certain days? Which issues keep coming back? Are long handle times caused by weak training, bad routing, or customers reaching the wrong department in the first place? Most SMB owners don't lack call data. They lack a usable way to turn it into decisions.
That gap gets expensive fast. Missed calls look like lost demand. Long waits frustrate good customers. Staffing becomes guesswork. Coaching turns into opinion instead of evidence. If you run support, sales, scheduling, or dispatch, you can feel the problem every week.
Call center analytics software fixes that when it's used correctly. Not as a dashboard trophy. Not as another admin screen nobody checks. Used well, it becomes the operating system for improving service quality, team performance, and day-to-day efficiency.
Why Your Call Data Is a Goldmine You Are Not Using
A common SMB scenario looks like this. The owner notices complaints about hold times. A supervisor says Mondays are always bad. One agent insists billing calls are taking longer. Another blames the phone menu. Everyone has a theory, but nobody has proof.
Meanwhile, the phones keep ringing.
Xima Software reports that the average call center handles roughly 4,400 calls each month, and that 50% of businesses already use AI-driven tools such as call center software or knowledge bases, with another 34% planning to adopt them soon in its call center statistics overview. For an SMB, that matters because even a modest operation generates more conversations than any manager can review manually.
What flying blind looks like
When teams don't use analytics well, the symptoms are easy to spot:
- Staffing stays reactive: You add people after service levels slip instead of adjusting schedules before queues build.
- Coaching stays subjective: Supervisors coach based on memorable bad calls, not repeatable patterns.
- Customer pain stays hidden: Customers may be calling repeatedly about the same issue, but the business treats each contact like a separate problem.
- Marketing and operations disconnect: Call spikes hit the team without warning because nobody tied campaign activity to inbound demand.
Practical rule: If your team can tell you call volume is high but can't tell you why customers are calling, where delays happen, and what changed after a process fix, you're collecting records, not using analytics.
Your phone system is already generating signals
Every call leaves clues. Arrival time. Queue time. Transfer path. Talk time. Outcome. Repeat contact. Add recordings, CRM notes, and dispositions, and you have a detailed picture of how work moves through your business.
The problem isn't a lack of raw material. The problem is that most SMBs never organize it into something managers can act on. That's where call analytics software starts paying for itself. It turns scattered call activity into patterns you can see, question, and improve.
Good operators don't need more noise. They need an instrument panel. Without one, you're trying to manage customer experience from anecdotes and gut feel.
Understanding Call Center Analytics Software
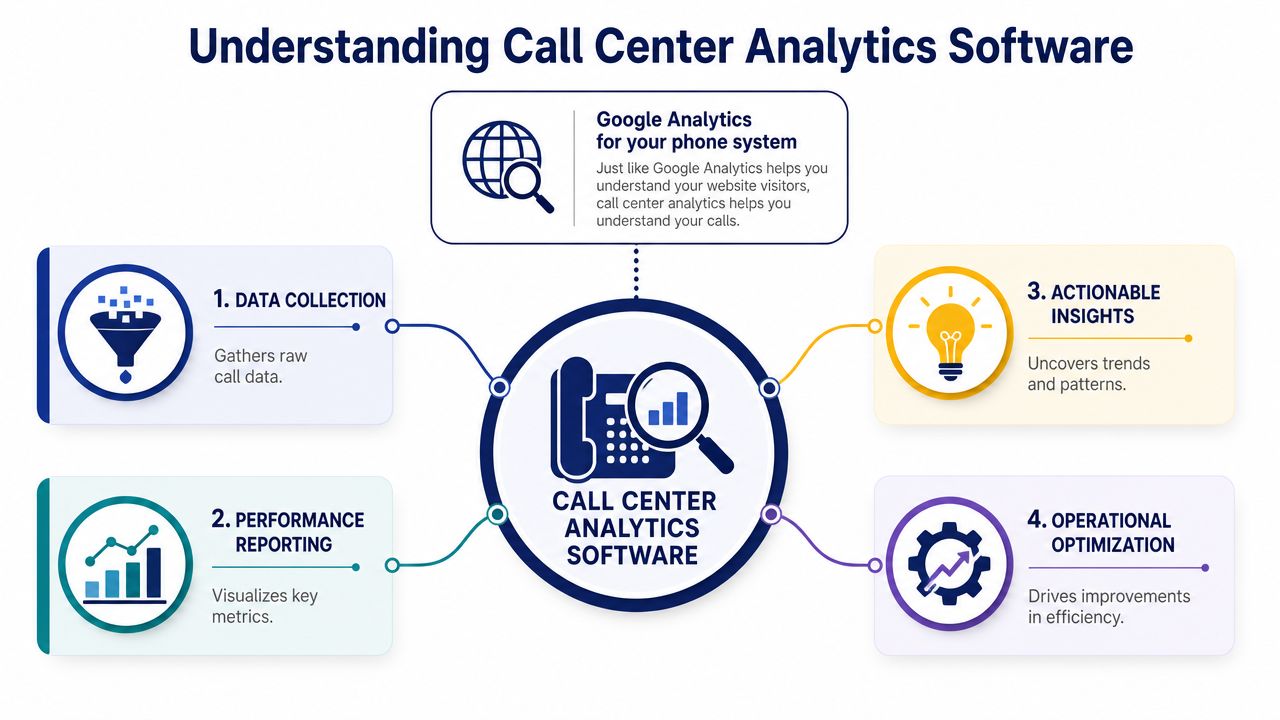
The simplest way to explain call center analytics software is this: it's Google Analytics for your phone system and customer conversations.
It collects interaction data, organizes it, analyzes it, and presents it in a way that helps you decide what to fix next. That sounds simple, but the value depends on how broad the data picture is and whether the reports effectively support action.
It does more than count calls
Modern platforms don't stop at basic call logs. Salesforce notes that modern analytics commonly combine data from call logs, CRM systems, IVR systems, chat transcripts, emails, and social media in its guide to contact center analytics. That broader view matters because service problems rarely stay in one channel.
A customer may start in chat, call when that fails, then respond to an email later. If your reporting treats those as unrelated events, managers get a distorted picture. If your analytics joins them, you can see the whole service journey.
The four jobs analytics software should handle
In practical terms, the software should do four things well:
Collect data automatically
Pull interaction records from your phone system, CRM, IVR, and related tools without relying on manual exports.Organize data consistently
Group conversations by queue, agent, topic, channel, and outcome so reports don't become a mess of isolated records.Analyze for patterns
Surface trends in metrics such as average handle time (AHT), first call resolution (FCR), and customer satisfaction (CSAT) rather than forcing managers to hunt through spreadsheets.Visualize what matters
Show the data in dashboards, filters, and reports that let supervisors act during the day, not after the damage is done.
Analytics only becomes useful when managers can connect what happened, why it happened, and what to change next.
If your business is still wrestling with fragmented reporting across several tools, a broader data foundation helps. Teams that need cleaner reporting workflows often benefit from stronger data handling practices like those described in CloudOrbis data management, especially when customer interactions live across multiple systems.
The best call center analytics software doesn't just tell you how many calls came in. It gives you a usable view of service demand, process friction, and team execution.
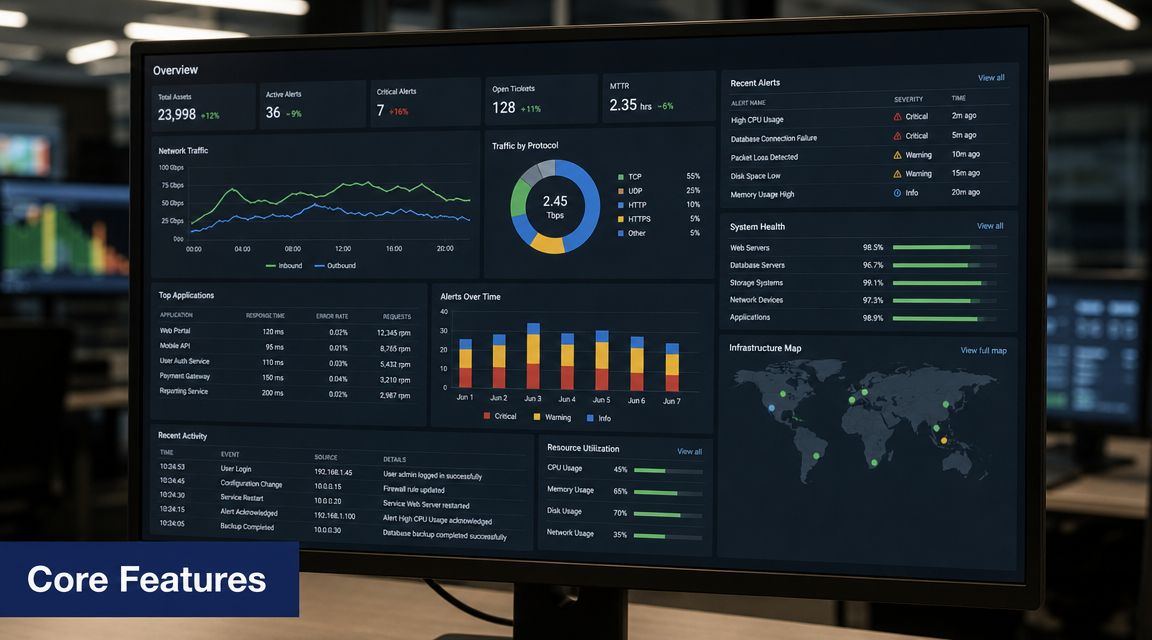
Core Features of Call Center Analytics Software
When buyers compare platforms, feature lists start to blur. Most demos sound polished. Most dashboards look modern. The difference is whether the underlying analytics can uncover what is slowing your team down and what to do about it.
RingCentral describes call center analytics software as being built around four technical layers in its overview of contact center analytics.
Speech and conversation analytics
This layer transcribes calls and analyzes what was said. It looks for keywords, sentiment, compliance language, recurring call reasons, and conversational patterns.
For an SMB, this usually answers questions you can't solve from call duration alone. Why are invoice calls dragging on? Why do cancellation calls escalate? Are customers confused about one policy, one location, or one product line?
What this means for you: if customers keep calling about the same issue, speech analytics helps you find the root cause faster than listening to random recordings.
Desktop analytics
Desktop analytics tracks what agents do across their applications while they work. It can show switching between systems, time spent in certain screens, and workflow friction that callers never see directly.
A slow call isn't always an agent problem. Sometimes the agent is waiting on a slow CRM, copying details between tools, or re-entering information in multiple systems.
What this means for you: if one team has longer handle times, desktop analytics can reveal whether the cause is training, process design, or clunky software.
Omnichannel analytics
This layer combines phone, email, chat, and social interaction data into one reporting model. It's essential if your business supports customers in more than one way.
Without it, leaders often optimize the phone queue while missing the bigger issue. Customers may be bouncing between channels because the first interaction didn't resolve the problem.
What this means for you: if customers contact you in several channels before getting help, omnichannel analytics helps you measure the full path instead of grading only the final phone call.
A short explainer can help make these categories more concrete:
Predictive analytics
Predictive analytics uses historical interaction patterns to forecast demand, identify likely bottlenecks, and support staffing decisions before service degrades.
Software moves from reporting the past to helping manage the near future. For an SMB, that often means seeing regular surges tied to day of week, billing cycles, promotions, weather, or staffing gaps.
Field note: Predictive tools are only useful when managers trust the inputs. If dispositions are sloppy, CRM data is incomplete, or queues are mislabeled, the forecast won't save you.
What works and what doesn't
A practical buying lens helps here.
- What works: Features tied to repeat management actions such as queue adjustments, coaching, routing changes, and staffing updates.
- What doesn't: Fancy visualizations with no path from insight to action.
- What works: Searchable call topics, usable filters, and reports that frontline supervisors can understand quickly.
- What doesn't: Analytics that require an analyst to interpret every dashboard before anyone can act.
Strong call center analytics software translates technical capability into daily operating discipline. That's the test.
The Most Important Call Center KPIs to Track
Contact centers track too many numbers and act on too few. A better approach is to start with a small KPI set that connects directly to customer experience and operating efficiency.
For SMBs, the starter kit usually includes the metrics that reveal whether customers are getting through, whether agents are resolving issues efficiently, and whether service quality is improving or slipping.
Essential Call Center KPIs for SMBs
| KPI | Definition | Why It Matters for SMBs |
|---|---|---|
| AHT | Average handle time. The total time spent handling a customer interaction, including talk time and related work. | Helps you see whether work is flowing efficiently or getting stuck in process, training, or system issues. |
| FCR | First call resolution. Whether the customer's issue gets resolved on the first contact. | A strong sign of service effectiveness. Repeats usually increase workload and frustrate customers. |
| CSAT | Customer satisfaction. Usually gathered from post-interaction feedback. | Shows whether customers felt the experience was successful, not just fast. |
| ASA | Average speed of answer. How quickly agents answer incoming calls. | Useful for spotting queue pressure and schedule mismatches. |
| Abandonment rate | The share of callers who hang up before reaching an agent. | Often exposes wait-time problems, poor routing, or staffing gaps. |
| Agent occupancy | How much of an agent's available time is spent handling work. | Helps balance utilization and burnout risk. |
How to read these metrics properly
The mistake I see most often is treating one KPI as the whole story.
AHT is the classic example. Lower handle time can be good if it reflects cleaner workflows and faster answers. It can also be bad if agents rush customers off the phone, transfer too early, or fail to resolve the issue. The number by itself doesn't tell you which one is happening.
FCR has a similar trap. Teams love the idea of first-contact resolution, but if agents mark interactions as resolved while customers call back later, the metric becomes theater.
Don't reward a metric in isolation. Pair efficiency metrics with quality and outcome metrics so your team can't improve one by damaging another.
A practical starter stack
If you want a manageable dashboard, begin with these priorities:
- Use AHT to find friction: Review long-handle categories by queue, call reason, and agent group.
- Use FCR to judge resolution quality: Check repeat contacts and transfer patterns, not just disposition codes.
- Use ASA and abandonment rate to monitor access: These show whether customers can reach you without giving up.
- Use CSAT to validate operational changes: If a scheduling or routing fix improves speed but customer sentiment drops, the change may have solved the wrong problem.
If you're tightening service standards, it helps to pair KPI review with a disciplined call center quality monitoring process so numbers and actual call behavior stay aligned.
The point of KPI tracking isn't to create more reports. It's to make better operating decisions with less guesswork.
Integrating Analytics with Your VoIP Phone System
A lot of SMBs still manage call reporting the old way. Someone exports logs. Another person cleans up the spreadsheet. A manager compares tabs, notices something odd, and asks for recordings days later. By then, the staffing issue or customer complaint has already moved on.
That process breaks because it is slow, manual, and easy to distort.
The old way versus the integrated way
| Approach | What it looks like | Main drawback |
|---|---|---|
| Manual reporting | Export call logs, combine files, sort data in spreadsheets | Delayed insight and inconsistent interpretation |
| Separate analytics tool | Pull data into another platform after the fact | Gaps appear when integrations are weak or fields don't match |
| Integrated VoIP analytics | Data flows from the phone system directly into dashboards and reports | Stronger visibility, but only if setup and categories are clean |
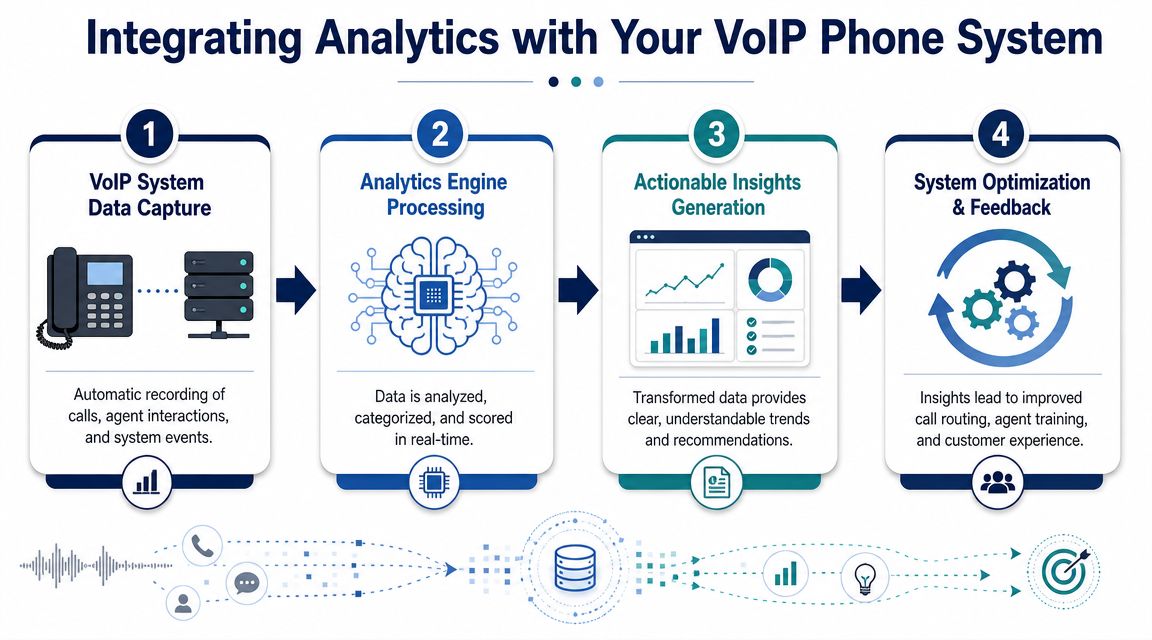
Why integration changes the management rhythm
When analytics is built into the VoIP environment, reporting becomes part of the operating day instead of a separate admin task. Supervisors can spot queue buildup while it's happening. Managers can compare answer speed, abandoned calls, and routing outcomes without waiting for end-of-week cleanup.
That doesn't just save time. It improves decision quality. Integrated reporting reduces the chance that one spreadsheet uses different labels, date ranges, or filters than another.
Where CRM matters most
The biggest jump in usefulness happens when phone analytics connects to customer records. Then you can move beyond call counts and start asking better questions.
Which call types lead to repeat contacts? Which customer segments experience the longest waits? Which agents resolve issues cleanly without requiring follow-up? That kind of visibility depends on tying conversations to the business context around them.
A solid CRM with VoIP integration makes that possible by reducing the separation between communication data and customer data.
Integrated analytics doesn't mean simpler management by default. It means faster truth. You still need clean queues, sensible tags, and managers who act on what they see.
If you're choosing between a standalone reporting add-on and analytics inside your phone platform, favor the setup that gives supervisors real-time visibility with the least manual handling. In SMB operations, simplicity often beats theoretical flexibility.
Choosing and Implementing the Right Analytics Solution
The best platform isn't the one with the longest feature list. It's the one your team will use to improve outcomes.
That sounds obvious, but buyers still get pulled toward flashy dashboards, AI labels, and demo-friendly features that never become part of weekly management. The result is a system that generates visibility but not change.
AmplifAI makes the key buying point clearly in its discussion of call center analytics software. The platform should connect interaction data with CRM, QA, workforce, and outcome data so you can measure changes in retention or resolution, not just call-volume metrics. Without that workflow connection, you may gain visibility without improving performance.
Questions to ask before you buy
Use these questions in vendor conversations:
- Can the platform connect data sources that matter to us? Ask specifically about CRM records, QA workflows, workforce data, surveys, and call outcomes.
- Can supervisors use it without an analyst? If every report requires technical support, adoption will stall.
- How does it prove operational impact? Ask how the system tracks changes in resolution, repeat contacts, coaching outcomes, or customer experience after process changes.
- What happens after insight is found? Good systems support action through alerts, workflows, QA follow-up, or coaching steps.
- How hard is setup and maintenance? Reporting logic that is fragile or overly custom becomes expensive to keep accurate.
If you're comparing broader reporting options, a resource like this BI software comparison can help frame the difference between generic business intelligence tools and purpose-built operational analytics.
What a smart rollout looks like
Implementation fails when teams try to track everything at once. It also fails when leadership delegates the tool to one admin and never changes operating habits.
A practical rollout is narrower.
Baseline the current state
Capture where you are now on a few core service and efficiency measures.Choose a small outcome set
Focus on a limited set of operational and customer outcomes tied to real pain points.Map actions to insights
Decide in advance what managers will do if wait times rise, repeat contacts increase, or one call reason spikes.Train supervisors first
Frontline managers are the difference between a useful system and an ignored dashboard.Review weekly, not randomly
Build a recurring rhythm for reading reports, testing changes, and checking whether results moved.
Buyer warning: If a vendor can show you features but can't show you how a manager moves from insight to action, keep looking.
The goal isn't analytics maturity. The goal is better service, better staffing decisions, and fewer preventable customer frustrations.
SMB Use Cases How SnapDial Analytics Solve Real Problems
Most SMB buyers don't need abstract theory. They need to know how analytics helps on a Tuesday afternoon when the phones are busy and nobody agrees on what's wrong.

Problem missed calls during lunch
The pain point is simple. Customers call at midday, nobody picks up fast enough, and the business assumes demand is just inconsistent.
The fix comes from queue and time-of-day reporting inside the analytics dashboard. A manager can spot the exact window where answer speed drops and abandoned calls rise, then adjust lunch coverage, routing, or callback handling.
Problem unclear marketing results
A team launches a campaign and the owner asks whether it drove real phone demand. Without analytics, the answer is usually based on hunches and receptionist feedback.
The dashboard helps by showing inbound trends by time period, queue, and destination. That makes it easier to connect campaign timing to call activity and see whether the business needs more front-desk coverage when promotions go live.
Problem inconsistent agent performance
One supervisor says an agent is slow. Another says the same agent handles the hardest calls. Both may be right.
Analytics helps separate workload mix from execution by comparing handle time, transfers, and resolution patterns across teams and call types. That gives managers a cleaner basis for coaching.
Problem recurring customer complaints with no clear root cause
Customers keep calling back about the same issue, but each interaction is treated as a one-off.
Reporting and recording review help managers find repeated call reasons, isolate weak points in routing or process, and decide whether the solution belongs in training, scripting, staffing, or policy.
If you're replacing an older phone system or you want analytics built into a cloud calling platform from day one, SnapDial is worth a close look. Its hosted VoIP platform includes real-time statistics, detailed reporting, queue tools, call recording, CRM-friendly workflows, and a self-service portal that makes day-to-day administration easier for growing teams. For SMBs that want better visibility without piling on more disconnected tools, that's a practical place to start.