

A Monday dashboard can make a new contact-center manager feel like a pilot facing a cockpit full of warning lights. Average handle time is rising, average speed of answer looks uncomfortable, occupancy is high, and customer satisfaction has slipped. First-contact resolution and abandonment rate are also moving, but the dashboard doesn't explain which signal is the cause and which is the consequence.
That confusion is common because call center KPIs aren't a checklist of independent numbers. They're a balanced operating system. Speed affects resolution, resolution affects customer experience, and staffing decisions influence all three. A useful KPI program helps you identify the next operational decision, not just admire a wall of charts.
A Monday Morning in the Contact Center
At 8:05 on Monday morning, Maya opens the weekly performance dashboard for her support team. The first tile shows AHT. The next shows ASA. Below them sit FCR, CSAT, occupancy, and abandonment. Every number has a color, but the colors don't tell her where to begin.
Her instinct is to attack the most visible problem. If AHT is high, perhaps agents need to shorten calls. If ASA is high, perhaps she needs more people in the queue. If abandonment is rising, perhaps the IVR needs new prompts. Each idea could be reasonable, but applying all of them at once would turn a diagnosis into guesswork.

Maya's operations lead gives her a useful analogy. A car dashboard doesn't tell a driver to make every warning light green at the same time. It shows speed, fuel, temperature, and engine condition because those readings answer different questions. The driver interprets them together. A contact-center manager should do the same.
Practical rule: Never change an agent target until you can explain which customer or operational problem the change is meant to solve.
Call-center KPI programs became more standardized as contact centers moved from basic call counting into formal performance-management systems. Modern benchmark frameworks commonly track AHT, FCR, ASA, CSAT, occupancy, and service level, because no single metric can describe a complete operation. The Genesys overview of call-center metrics also illustrates why speed, resolution, staffing, and quality need to sit beside one another.
The practical sequence is simple. Sort metrics into families first, understand the formulas second, then connect each measure to a system and an improvement action. Once those foundations are in place, a 90-day rollout becomes manageable instead of overwhelming.
The Four Families of Call Center KPIs
Your KPI dashboard works best when organized into four families: speed, resolution, staffing, and quality. Each family answers a different management question, and SnapDial helps capture the related activity so a manager can connect a number with an operational cause.
Speed
Speed KPIs answer, “How quickly does a customer reach and move through service?” The main measures are ASA, AHT, and abandonment rate.
ASA records queue response time. AHT covers talk, hold, and after-call work. Abandonment shows how many customers leave before an agent answers. These measures interact, but they are not interchangeable. A short AHT will not solve a long queue wait. In SnapDial, queue reporting and interaction records give managers the context to see whether the problem starts before the conversation or during it.
Resolution
Resolution KPIs answer, “Did the customer get a complete answer?” FCR measures whether the issue was resolved during the first interaction, while repeat-call rate shows how often customers return about the same problem. A team can answer quickly and still create extra demand if customers must call again. SnapDial's interaction history helps managers review repeat contacts and identify where scripts, routing, or agent guidance need adjustment.
Staffing
Staffing KPIs answer, “Does the operation have the right capacity at the right time?” Occupancy shows how much of logged-in time agents spend handling contacts. Utilization and schedule adherence add context about availability and workforce discipline, while shrinkage accounts for meetings, training, and planned leave.
These measures explain whether weak service comes from process design or insufficient coverage. SnapDial's queue and agent activity data can show when demand exceeds available capacity, helping managers adjust schedules without treating every delay as an agent-performance issue.
Quality
Quality KPIs answer, “Was the interaction accurate, helpful, and satisfactory?” CSAT reflects the customer's view of a specific interaction. NPS reflects broader loyalty, and QA scores assess whether the agent followed defined service and compliance standards. SnapDial can connect interaction records with feedback and review workflows, giving managers evidence for coaching rather than relying on speed alone.
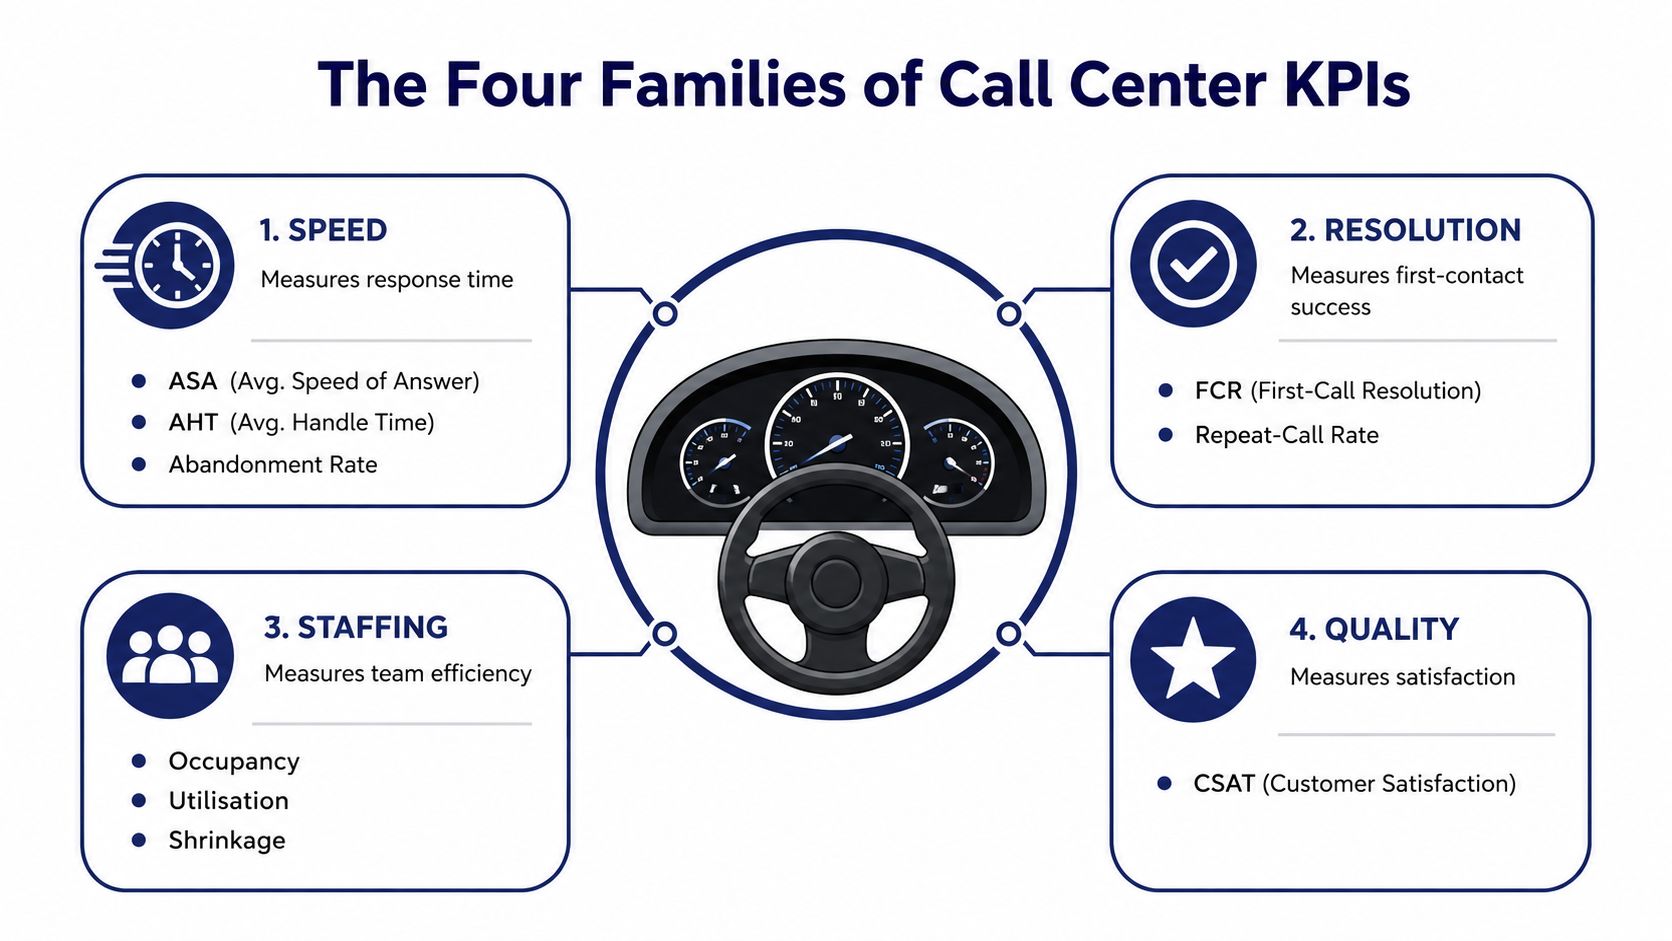
The four families protect against one-number management. Pushing speed without checking resolution can rush customers off the phone. Maximizing occupancy without monitoring quality can increase fatigue, errors, and dissatisfaction. A balanced dashboard keeps speed, customer outcomes, staffing cost, and service quality in view together.
Essential KPIs, Formulas, and Realistic Benchmarks
A formula defines the measurement. A benchmark provides a reference point. Neither is a universal verdict. Call complexity, channel mix, customer expectations, and operating model can shift the result, so read the dashboard as a set of connected signals rather than a checklist.
| KPI | Formula | SMB Target | Mid-Market Target |
|---|---|---|---|
| AHT | (Talk time + hold time + after-call work) ÷ handled contacts | Establish a baseline by contact type | Set separate ranges by queue and complexity |
| ASA | Total queue wait time for answered contacts ÷ answered contacts | Around 20 to 40 seconds for mainstream queues | Around 20 to 40 seconds, with priority queues potentially below 20 seconds |
| FCR | First-contact resolutions ÷ first contacts × 100 | Above 70% | Above 70% |
| CSAT | Satisfied responses ÷ total responses × 100 | Above 80% | Above 80% |
| Occupancy | Handling time ÷ logged-in time × 100 | Roughly 75% to 85% | Roughly 75% to 85% |
| Abandonment rate | Abandoned contacts ÷ incoming contacts × 100 | Below 5% | Below 5% |
These figures appear in current guidance, including the 2026 call-center metrics benchmark guide. It lists FCR above 70%, CSAT above 80%, average queue time under 90 seconds, hold time under 2 minutes, repeat-call rate below 10%, and cost per contact trending below about $6 as practical reference points. Treat them as navigation markers, not performance quotas for agents handling unusually complex work.
AHT shows how much time each handled contact consumes across talk, hold, and after-call work. Managers can lower it by improving knowledge access, or by ending conversations too quickly. The second method may reduce AHT while increasing transfers, repeat contacts, or dissatisfaction. Use average handle time with local call-type data so SnapDial reports efficiency alongside the customer outcome.
ASA measures the wait before an answered contact reaches an agent. A mainstream queue often targets roughly 20 to 40 seconds, while elite or priority queues may aim below 20 seconds, according to ASA and occupancy benchmark guidance. Occupancy generally sits in a healthy range around 75% to 85%, with about 85% often treated as a practical ceiling. Beyond that point, recovery time shrinks, and a small demand increase can produce longer queues.
Speed and cost need a quality counterweight. FCR and CSAT show whether faster handling helps customers, while occupancy indicates how heavily the schedule is being used. For managers connecting contact-center activity with commercial outcomes, key selling performance indicators provides a useful comparison.
Start with a clean internal baseline for four to six weeks. Segment results by queue, intent, channel, and complexity before changing a target, then use SnapDial's captured interaction data to compare like with like.
Where Each KPI Gets Measured in Your Stack
A KPI can look wrong because the operation is wrong, or because two systems count the same event differently. Before coaching an agent, identify where the signal originates.
The ACD and IVR layer usually produces ASA, AHT, occupancy, queue wait, service level, and abandonment. The CRM supplies disposition codes, customer history, transfer reasons, and the fields needed to estimate FCR. Post-call surveys produce CSAT, while a separate QA tool or recording workflow supplies evaluation scores. Ticket systems are the natural source for measures based on case timestamps and follow-up activity.
| KPI | Primary System | SnapDash Coverage |
|---|---|---|
| ASA | ACD and queue | Real-time queue visibility and reporting |
| AHT | ACD and call records | Direct reporting |
| Occupancy | ACD and workforce data | Requires configuration or workforce integration |
| Abandonment | ACD and IVR | Direct queue reporting |
| FCR | CRM dispositions and case history | Requires CRM integration |
| CSAT | Survey platform | Built-in survey data can be surfaced |
| QA score | QA sampling and recording tool | Requires QA workflow or integration |
SnapDial's reporting capabilities include real-time queue statistics, abandonment, AHT, and CSAT from built-in surveys. FCR, ticket-based resolution, and detailed QA scores need consistent CRM, helpdesk, or quality-system integration. Managers can use call center dashboards to bring operational signals into one view, but the dashboard won't repair inconsistent source data.
Three instrumentation habits prevent most reconciliation disputes:
- Define events consistently: Decide what counts as an answered call, abandoned call, resolved contact, and completed survey.
- Timestamp state changes: Record queue entry, answer, hold, wrap-up, transfer, and closure events in a consistent time zone.
- Reconcile weekly: Compare ACD totals with CRM contacts and ticket records, then document any expected difference.
A dashboard is only as honest as the events feeding it.
Reading KPIs as a System, Not Silos
A support team can have a bad week without having six separate problems. Often, one operational shock travels through the dashboard like a fault moving through a circuit.
Suppose a product update creates an unusual rush of customer questions. The queue fills, ASA rises, and more customers abandon before an agent answers. Agents then work under pressure, transfer uncertain cases, and close conversations without fully resolving the underlying issue. FCR falls, repeat contacts increase, and CSAT may decline after those unresolved interactions appear in follow-up feedback.
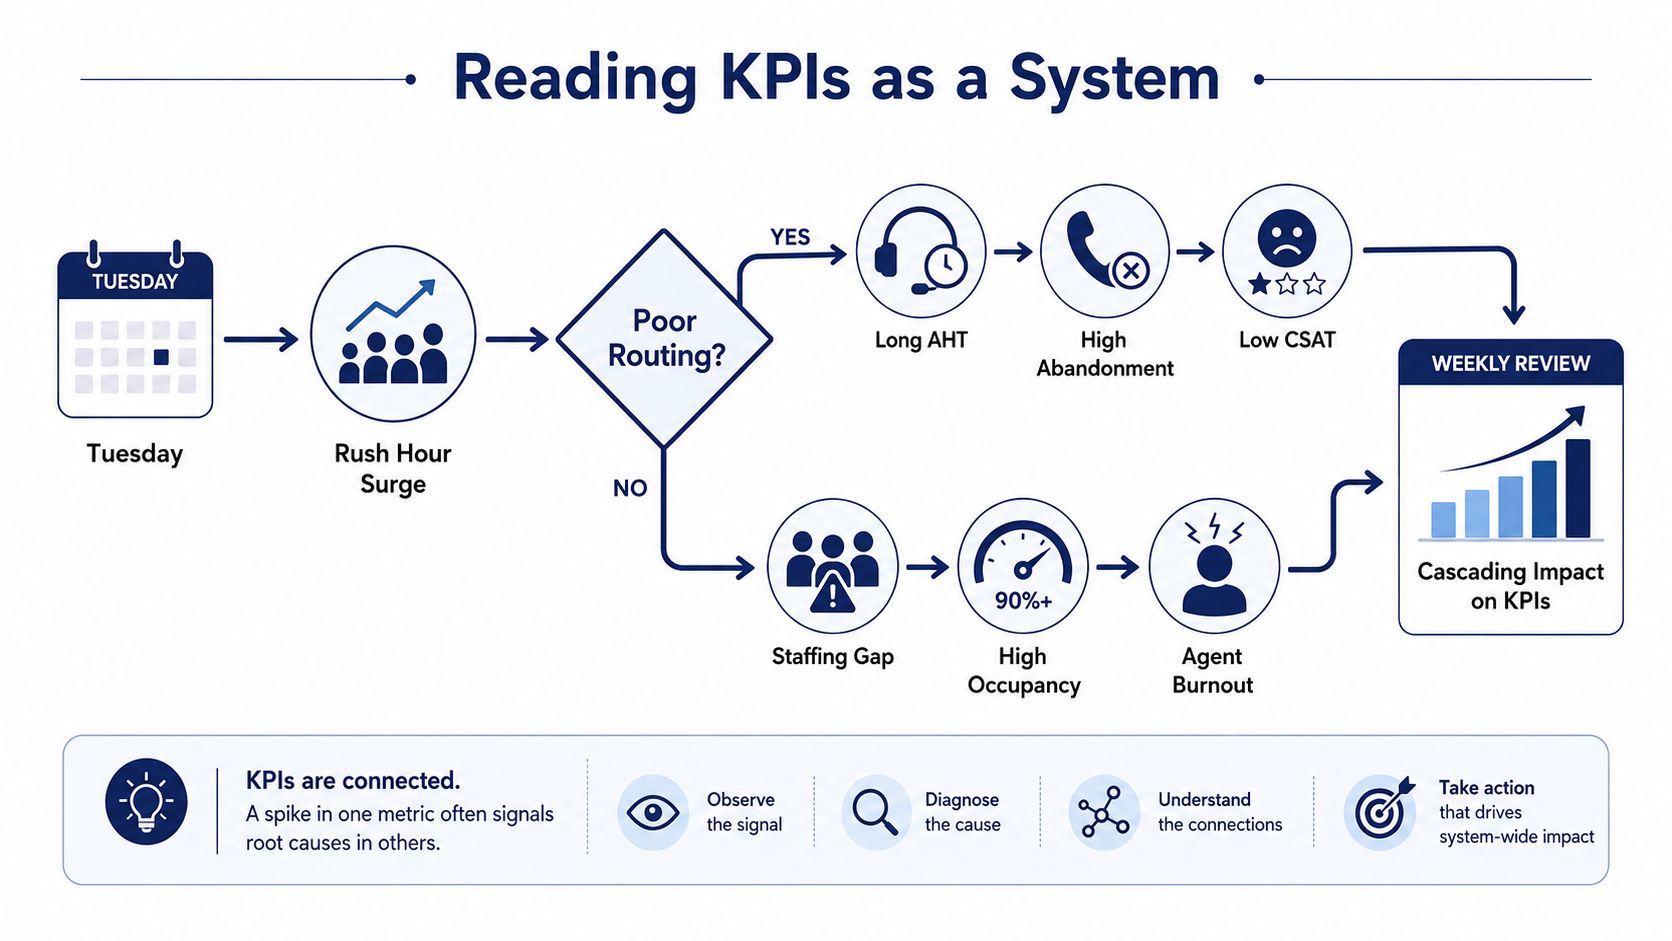
The manager shouldn't begin by rewriting the script. First, she should trace the chain backward. Did call arrival volume change? Did routing send the new issue to the right queue? Did scheduled staffing match the arrival pattern? Did occupancy leave agents enough capacity to document and diagnose cases properly?
A practical triage sequence
When one KPI worsens, inspect its neighbors in this order:
- Demand: Check arrival volume, contact reasons, and unusual product or billing events.
- Access: Review IVR paths, queue depth, ASA, service level, and abandonment.
- Capacity: Examine occupancy, schedule adherence, shrinkage, and intraday staffing.
- Resolution: Compare FCR, transfers, repeat-call rate, and escalation reasons.
- Experience: Review CSAT comments, QA findings, and recovery contacts.
This sequence keeps the manager from treating a symptom as a cause. High abandonment may reflect long waits, confusing routing, or a staffing mismatch. A sudden FCR decline may reflect a missing knowledge article rather than weak agent effort. The dashboard becomes useful when it tells a connected story.
Tactics That Move the Numbers
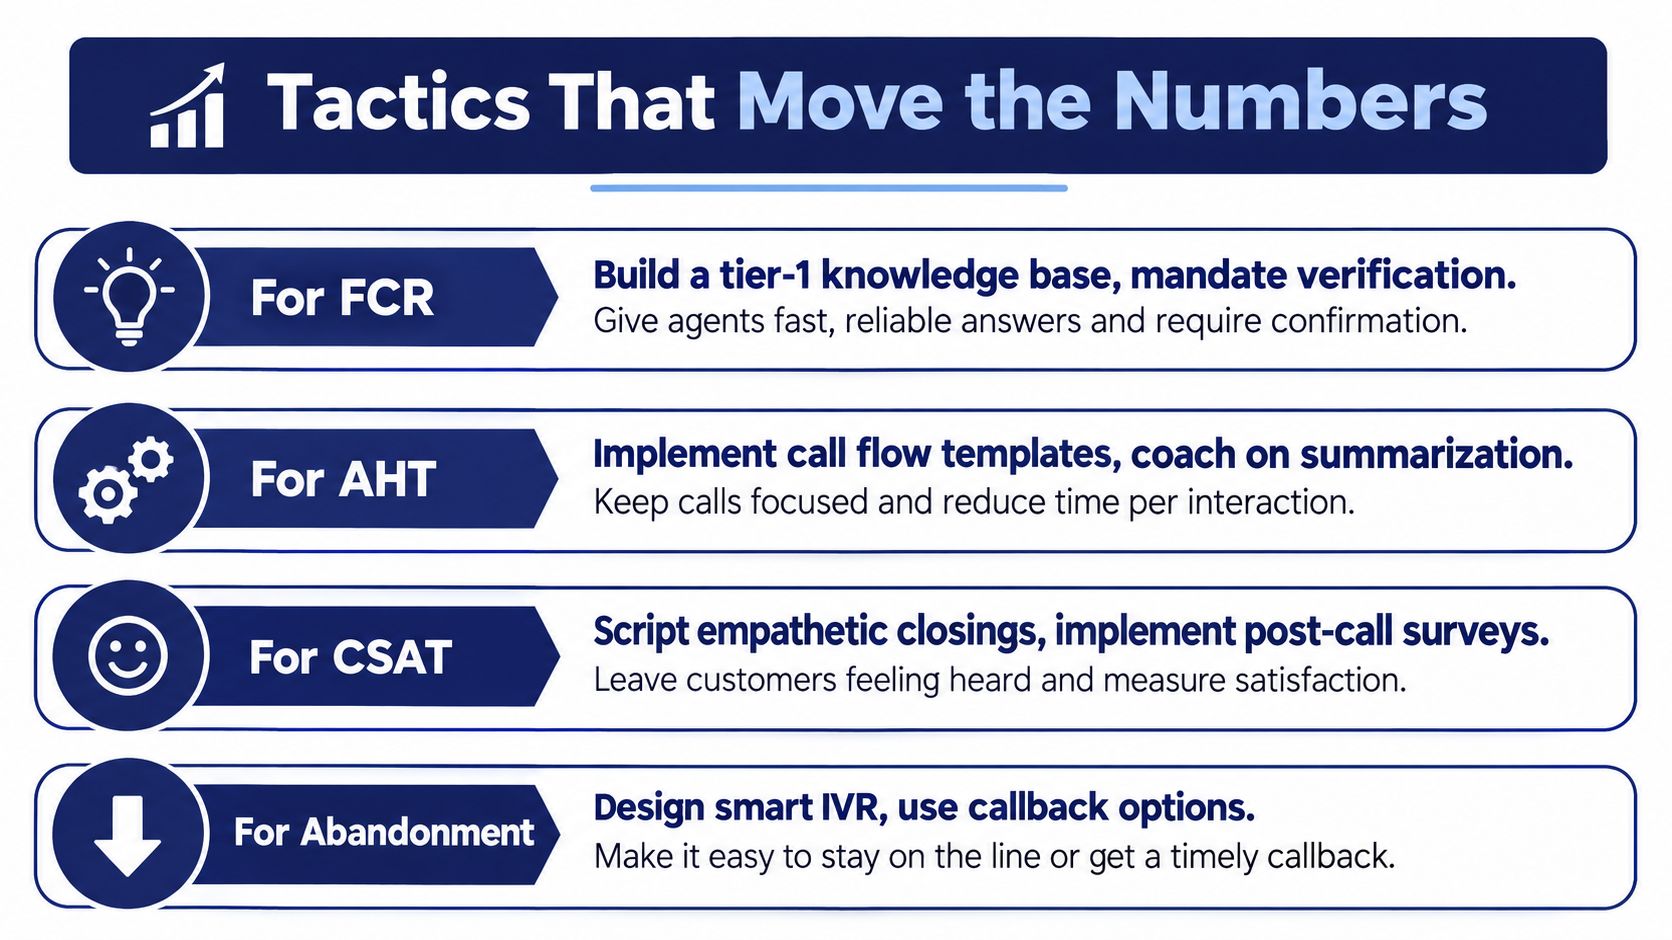
Hiring can add capacity, but it will not correct unclear routing, repetitive wrap-up work, or missing knowledge. Coaching and queue design often improve results sooner because they change how the existing team handles demand. Use the KPI dashboard as a balance of speed, quality, and cost, then connect each change to the SnapDial capability that captures or improves it.
Improve resolution first
For FCR, build a tier-one knowledge base around frequent issues. Include verification steps, escalation rules, and ownership for promised callbacks. Review transfer reasons weekly. If several agents transfer the same issue, update the process or article before assuming more training is needed. SnapDial call flows and interaction records can show where resolution breaks down.
Reduce waste without rushing
AHT often falls when managers remove unnecessary work rather than asking agents to speak faster. Replace free-text wrap-up notes with structured disposition codes where appropriate, create templates for repeatable interactions, and coach concise summaries. Use SnapDial's call records to identify avoidable silence, repeated questions, and difficult system navigation. A longer call may be the right result when diagnosis prevents another contact.
Make satisfaction actionable
After resolved interactions, use post-call surveys and route clear detractors into a recovery workflow. Supervisors can pair customer comments with recordings and QA scores during coaching. Call center quality monitoring connects those records, scorecards, and coaching actions, turning CSAT feedback into a specific behavior to practise, such as confirming the next step or explaining a limitation clearly.
Protect capacity
Occupancy improves when forecasting accounts for intraday shrinkage, breaks are staggered, and quieter periods support planned off-queue work. SnapDial queue controls can help managers review wait conditions and routing choices. Abandonment improves when the IVR gives accurate wait announcements, offers callbacks during deep queues, and routes customers by intent instead of a broad department label.
For work that owners should remove from their own plate, the guide to customer experience work owners must delegate offers a practical delegation lens. Inside the contact center, assign reporting and follow-up clearly so KPI actions do not remain with one manager.
Improving FCR can lift other measures indirectly. Complete answers reduce repeat contacts, which eases queue pressure and supports CSAT. Review the dashboard as a connected system, not a checklist of isolated numbers.
The Trap of Optimizing One Number Too Hard
A manager who pushes AHT as low as possible can produce a team that ends calls quickly but leaves customers without complete answers. Agents may skip verification, avoid complex cases, transfer sooner, or close abruptly. The dashboard then shows efficiency, while repeat contacts surface later through lower FCR, higher abandonment, and weaker CSAT.
Occupancy creates the same trap. A healthy range can leave agents enough recovery time, while sustained levels near the practical ceiling make the operation less resilient when demand changes. Short breaks, difficult calls, and unexpected volume spikes all become harder to absorb.
Manager's test: If this change moves X, what should it do to Y and Z?
Ask that question before changing a target, script, routing rule, or incentive. A lower AHT needs a check against FCR and CSAT. Faster ASA needs a check against occupancy and cost. Better service level needs a check against abandonment and agent workload. A balanced dashboard works like a vehicle's instrument panel: speed alone cannot show whether the engine is overheating or fuel is running low.
Do not use AHT as a standalone QA score. QA should examine accuracy, empathy, compliance, process adherence, and resolution quality. AHT belongs in an operational review, where managers compare queues and contact types rather than judging every call by one stopwatch.
SnapDial can help make those relationships visible by bringing call handling and queue activity into the same operating view. Managers can then connect a change in speed with its effect on quality, capacity, and cost instead of rewarding a number in isolation.
Every weekly meeting should begin with FCR, CSAT, and AHT. Together, they show whether the team resolved the right problem, served customers acceptably, and used time responsibly.
A 90-Day Plan and Quick Answers for Busy Managers
A new KPI program does not need every integration immediately. Build a dependable operating rhythm in stages, using one dashboard to keep speed, quality, and cost in view.
Days 1 through 30
Instrument the basics. Define each formula, identify the system that owns every field, and publish a dashboard for AHT, ASA, FCR, CSAT, occupancy, and abandonment. SnapDial can capture queue activity, call handling, routing, recordings, and reporting in one operating view. Compare dashboard totals with source records before setting individual-agent targets.
Days 31 through 60
Set queue-specific ranges and begin coaching workflows. Review transfer reasons, survey comments, QA findings, and repeat contacts together, because a faster call may still create more repeat work. If the team is expanding outbound coverage, review the best place to hire appointment setters as a separate workforce decision rather than mixing sales activity with support KPIs.
Days 61 through 90
Automate alerts, schedule a weekly KPI review, and assign an owner to every primary measure. Keep a decision log recording what changed, why it changed, and which neighboring KPIs managers checked afterward. SnapDial's real-time statistics and queue tools can show whether an intervention improved service without increasing workload or cost.
Quick answers
How do AHT and wrap time differ? AHT includes talk time, hold time, and after-call work. Wrap time covers only the post-call portion, so changing the definition can make historical comparisons misleading.
Does FCR include email follow-ups? Set a channel rule before reporting it. A phone-only FCR measure should exclude email, while an omnichannel resolution measure should connect all contacts to the same case.
How often should CSAT be sampled? Use a consistent survey method and review trends regularly. Response bias remains a concern, because customers who answer may not represent every interaction.
What is a healthy occupancy ceiling? About 85% is commonly treated as a practical ceiling, with roughly 75% to 85% viewed as a healthy range. Queue complexity and recovery time still matter.
Why can abandonment spike when ASA looks fine? ASA may average answered calls while customers who leave experience a different wait. Check queue segments, IVR friction, arrival bursts, and callback availability before concluding that staffing is adequate.
Start with clean definitions, connect related measures, and improve one operational cause at a time. SnapDial provides cloud calling with queue management, callbacks, wait-time announcements, real-time statistics, call recording, routing, and reporting for a balanced dashboard. Visit SnapDial to review those capabilities.