
A caller has already moved through your greeting, listened to the menu, and chosen the right queue. Then the music starts. The first announcement may say nothing, give a position, or offer an estimated wait time. In that brief moment, the caller is deciding whether to stay, hang up, try another channel, or accept a callback.
For a contact-center manager, that number has two jobs. It describes the queue's current workload and capacity, but it also changes caller behavior. A useful estimate can make a long wait feel manageable. A confident estimate that proves wrong can create a second service failure before an agent ever answers.
What Callers Hear Before Anyone Picks Up
A caller may hear hold music while your dashboard shows available agents, active calls, and a stable average speed of answer. Those are different views of the same queue. The manager sees capacity signals. The caller hears silence between announcements and starts judging whether staying is worthwhile.
The journey usually begins with an automated greeting and menu choices for billing, technical support, or sales. After the caller selects an option, the system routes them through the IVR before reaching the queue. See our guide to what an IVR system does for more on this routing layer. The next announcement may give a queue position or estimated wait time, and callers can treat that figure as a firm commitment even when it is only a forecast.

The number on an operations screen can differ sharply from the experience in the caller's ear. One benchmark reported a company-side average hold time of 58.3 seconds, while fewer than 3% of consumers said their average holds were that short. The same research reported an average wait of around 12 minutes, with telecom calls averaging 2 minutes 3 seconds and energy calls reaching 85 minutes. A blended average can therefore conceal the conditions of a specific queue or sector. The RingCentral wait-time and customer-service research documents this gap between operational reporting and customer experience.
The number does more than describe the line
“About two minutes” gives a caller a boundary and may make staying feel reasonable. Silence sends a different signal. Even if an agent will answer soon, the caller may read the lack of information as evidence that the queue is unmanaged.
That makes the announcement a demand-shaping tool. Some callers stay, some hang up, and others choose a callback or another channel. The estimate changes those decisions before an agent handles the contact.
Research on customer patience found that 54% of respondents hang up after eight minutes, while 31% wait five minutes or less. Microsoft's documentation on average wait time describes the estimate as a data-dependent value rather than a fixed timer. For a new manager, review both sides of the calculation: the workload and capacity behind the number, and the behavior the announcement is likely to produce.
How Estimated Wait Time Actually Works
Estimated wait time, or EWT, forecasts how long a caller may wait before an agent answers. It combines incoming demand, service speed, and available capacity. The result is a prediction, not a promise, and it is not the time already spent in the queue.
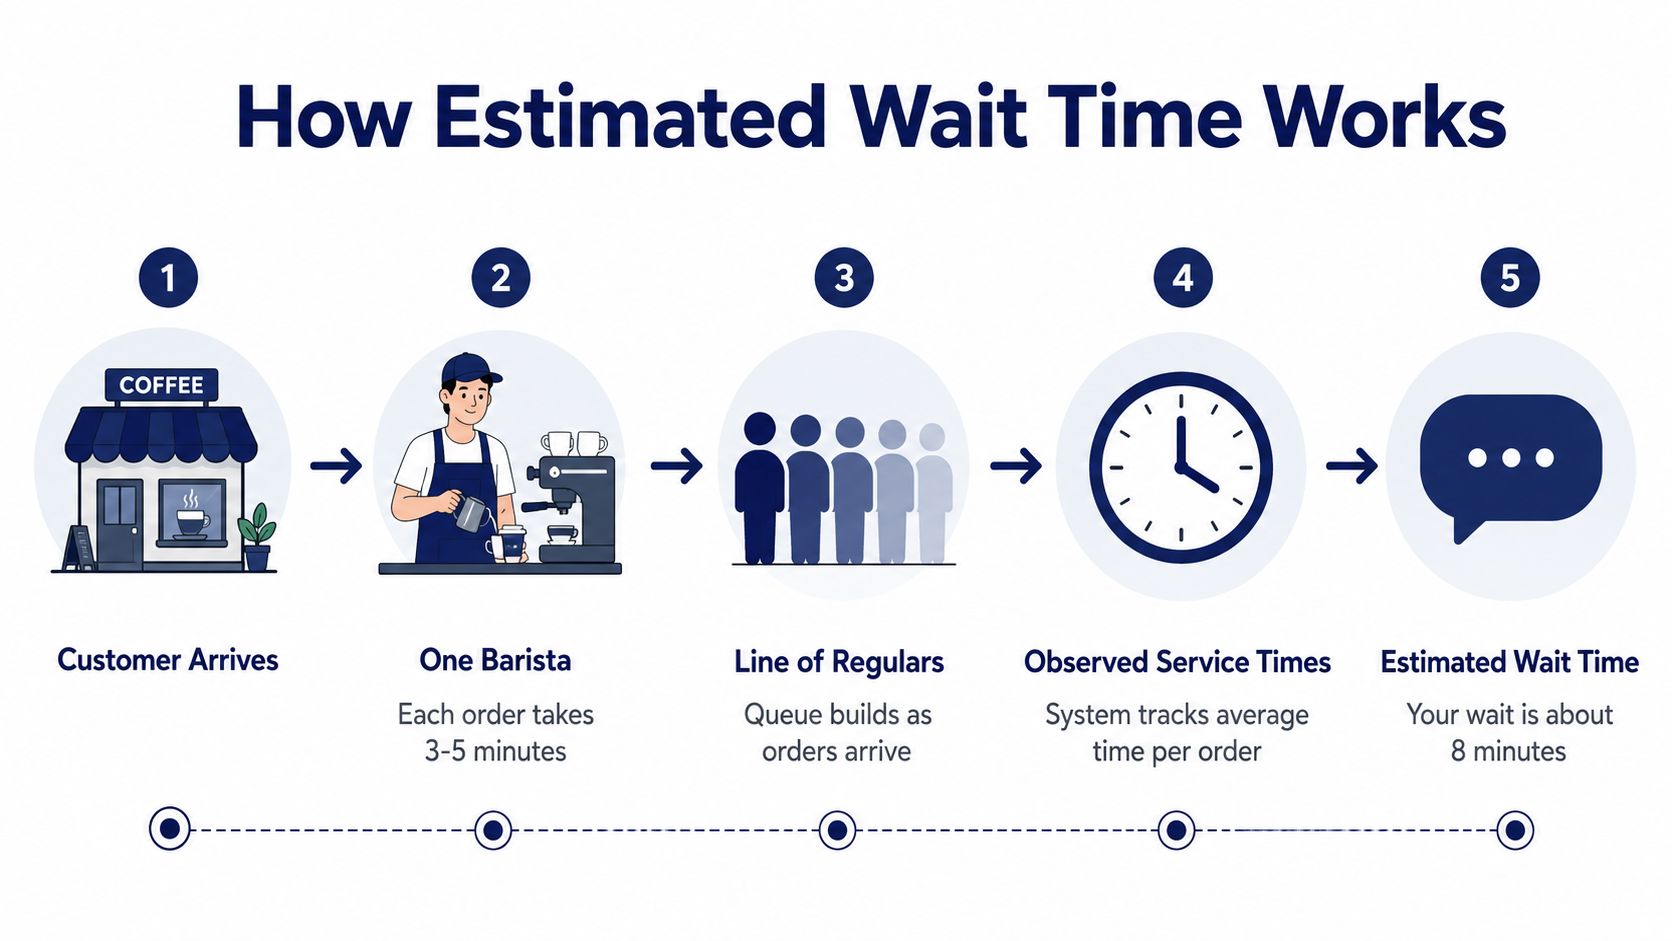
A coffee shop with one barista makes the logic easier to see. Three customers are ahead of you, each order takes several minutes, and new customers keep arriving. The estimate depends on the orders ahead, the barista's observed service time, and the arrival pattern. Two complicated orders can change the forecast before your order reaches the counter.
Two ways systems build the forecast
A rolling average uses recent handling or service times, the work already ahead, and the pace at which that work is clearing. It is straightforward and can react quickly when queue conditions change.
A queueing model, often associated with Erlang-style calculations, examines more than the number of waiting calls. It considers call duration, agents serving calls, agents shared across queues, and queued demand. Google Cloud's documentation on contact-center EWT calculation describes this workload-and-capacity structure and its use in overflow routing and caller-facing interfaces.
Most modern dashboards use a blended forecast. Historical service behavior steadies the estimate, while current queue conditions let it respond to staffing, call volume, and handling-time changes. This approach is part of how queue management systems balance live conditions with historical patterns, including the key components of queue systems.
Practical rule: Treat EWT as a range of likely outcomes translated into a simple caller message. The shorter the message, the more carefully the underlying uncertainty must be managed.
A forecast also needs enough relevant history and timely refreshes to remain useful. A model built from thin or stale observations can look precise while missing current queue behavior. Managers should therefore review the workload and capacity behind the estimate, then consider how the announcement may change caller choices.
The distinction between service rate and capacity matters. A fast team can still produce a long wait when calls arrive faster than agents can complete them. Conversely, a modest staffing adjustment can improve waiting time sharply after queued demand has exceeded available capacity. SnapDial can present that changing estimate in the caller's queue experience, while keeping the operational calculation separate from any promise of an exact answer time.
The Inputs Behind a Reliable Estimate
A reliable EWT estimate starts with workload and capacity, then adjusts for demand that may arrive before the queue clears. Queue length shows how many calls are waiting, but it does not show how long each call occupies an agent or which agents can serve the queue.
Consider four agents, twelve calls waiting, an average handle time of 240 seconds, and new calls arriving at 10 per minute. A first-pass calculation based only on the work already in line may look manageable. Continued arrivals, after-call work, agent availability, and routing rules can widen the practical estimate to 10 to 14 minutes. This example illustrates the calculation, not a universal formula.
What the manager should watch
- Agents available: Count only agents qualified and ready for this queue, not everyone logged into the phone system.
- Agents busy: Active calls reduce immediate capacity. Shared agents may support one queue while leaving another exposed.
- Calls in queue: Calls ahead create the starting workload. A rising queue is more informative than one isolated snapshot.
- Average handle time: Talk time and after-call work both consume capacity. AHT drift can weaken an otherwise reasonable forecast. Review the operational definition in average handle time guidance.
- Arrival rate: New calls can enter faster than agents finish existing work, allowing the queue to grow even when every agent is occupied.
| Input | Baseline Value | Test Value | Resulting EWT | Why It Moved |
|---|---|---|---|---|
| Agents available | 4 | 5 | Lower | One additional agent increases service capacity |
| Calls in queue | 12 | 18 | Higher | More work sits ahead of each new caller |
| Average handle time | 240 seconds | 300 seconds | Higher | Each call occupies an agent longer |
| Arrival rate | 10 per minute | 7 per minute | Lower | Fewer new calls compete for capacity |
| After-call work | Included | Delayed | Higher | Agents remain unavailable after conversations end |
During busy periods, refresh these inputs hourly and watch for AHT drift, occupancy pressure, queue growth, concurrent callers, and skill-based routing delays. A queue may appear stable while a specialist queue accumulates calls because general agents cannot serve that skill.
The work after a conversation also belongs in the estimate. Wrap-up codes, documentation, transfers, callbacks, and follow-up tasks delay the next available-agent moment. If the model counts talk time but excludes those activities, the caller may hear a tidy number that performs poorly in practice. SnapDial can surface the changing estimate in the queue experience, while the operations team continues to manage the capacity calculation behind it.
Prediction Versus Promise and How to Announce It
The operational risk is that a prediction becomes a promise in the caller's mind. If the system announces four minutes and the caller waits ten, the result feels misleading, even when the difference reflects normal queue variation. Treat the estimate as a planning signal, then phrase it so callers understand its uncertainty.
A mean estimate can be too optimistic when the queue changes quickly. A percentile or buffer gives the announcement more room, covering ordinary conditions rather than representing only the middle of the distribution. The queueing research on delay announcements shows that announcement design can affect balking and reneging. Callers respond especially poorly when the actual delay exceeds the announced delay, so the message also shapes demand and patience.
Three announcement choices
Raw estimate: “Your wait time is about four minutes.” Use this with a stable queue, predictable handling times, and a caller base whose behavior is well understood. The message is direct, though a sudden increase in demand can turn the estimate into a disappointing expectation.
Buffered estimate: “Your wait time is about five minutes. Please continue to hold, and we'll update you if conditions change.” A buffer suits variable AHT, shared agents moving between queues, or arrivals that come in bursts. It gives callers a more cautious expectation without pretending to know the exact moment an agent will answer.
Callback offer: “Your estimated wait is longer than usual. You can request a callback and keep your place in line.” Offer this when a long or unpredictable wait is likely. Research and benchmarking on callback systems found reductions in online waiting time of up to 71%, and up to 86% during temporary congestion scenarios. Research and benchmarking on contact-center callbacks explains why taking callers out of live hold can reduce the burden more effectively than announcing a large number.
| Strategy | Best Queue Profile | Expected Abandonment Impact | Caller Fit |
|---|---|---|---|
| Raw estimate | Stable service times and predictable demand | Can support retention when accurate | Callers who need immediate service |
| Buffered estimate | Variable AHT or changing staffing | Reduces the shock of an overrun | Callers willing to remain on hold |
| Callback offer | Long or unpredictable waits | Can reduce live-queue abandonment | Callers who can't stay on the line |
Avoid precision the model cannot support. “About five minutes” is generally more credible than an exact figure that changes sharply moments later. SnapDial can present the changing estimate and callback choice in the queue experience, while operations managers monitor the capacity calculation behind the message.
Industry commentary places a good average wait around 20 seconds, while another benchmark describes 2 minutes or less as an acceptable average. UK regulator data for 2022 recorded average queue waits of 2 minutes 23 seconds for mobile customers and 2 minutes 37 seconds for broadband and landline customers. Talkdesk's average-wait-time benchmark discussion sets those ideals beside actual market conditions. An announcement cannot create capacity, but it can reduce the extra frustration caused by uncertainty.
Sample Scripts for Hold, Updates, and Callbacks
A good script gives the caller three things quickly: recognition, a realistic expectation, and a clear next option. It shouldn't sound like an apology loop, and agents or voice prompts shouldn't rush through the number.
Opening announcement
“Thanks for calling [Company Name]. We're connecting you with [Department]. Your estimated wait time is about [X minutes]. We'll update you if that changes. You can also request a callback by pressing [key].”
Use a calm pace and pause briefly before the estimate. The number needs to register. Avoid saying “you'll be connected in exactly [X minutes]” unless your operation can support that commitment.
If your system knows the caller's name, use it only where it sounds natural. A personalized opening can feel attentive, but repeating the name in every announcement will sound mechanical.
Mid-hold update
“Thank you for waiting. Your current estimated wait time is about [new estimate]. That's [about what we expected / slightly longer than expected] because call volume is [higher than usual / moving steadily]. Please continue to hold, or press [key] to request a callback.”
The phrase before the new number matters. “Slightly longer than expected” acknowledges a change without dramatizing it. “About what we said” reinforces trust when the model is tracking well.
Don't apologize twice for the same delay. One clear acknowledgment is enough. Don't read a changing estimate too quickly, and don't announce a lower number just to keep callers from abandoning if the queue data doesn't support it.
Callback transition
“We can call you back when an agent is ready, so you don't have to remain on hold. Press [key] to accept. We'll call [phone number] and keep your place in line. Press [key] to confirm, or press [key] to enter a different number. Your callback request is confirmed. Thank you, [caller name].”
The confirmation must answer the caller's practical questions. Which number will you use? Does the caller keep their place? What happens after acceptance? If the workflow can't preserve position, say so plainly rather than implying that it can.
Coach supervisors to review recordings for pace, clarity, and overpromising. The best script is still ineffective if the voice sounds rushed, the callback details are incomplete, or the estimate is treated as a guarantee.
Implementation Inside a Cloud Phone System
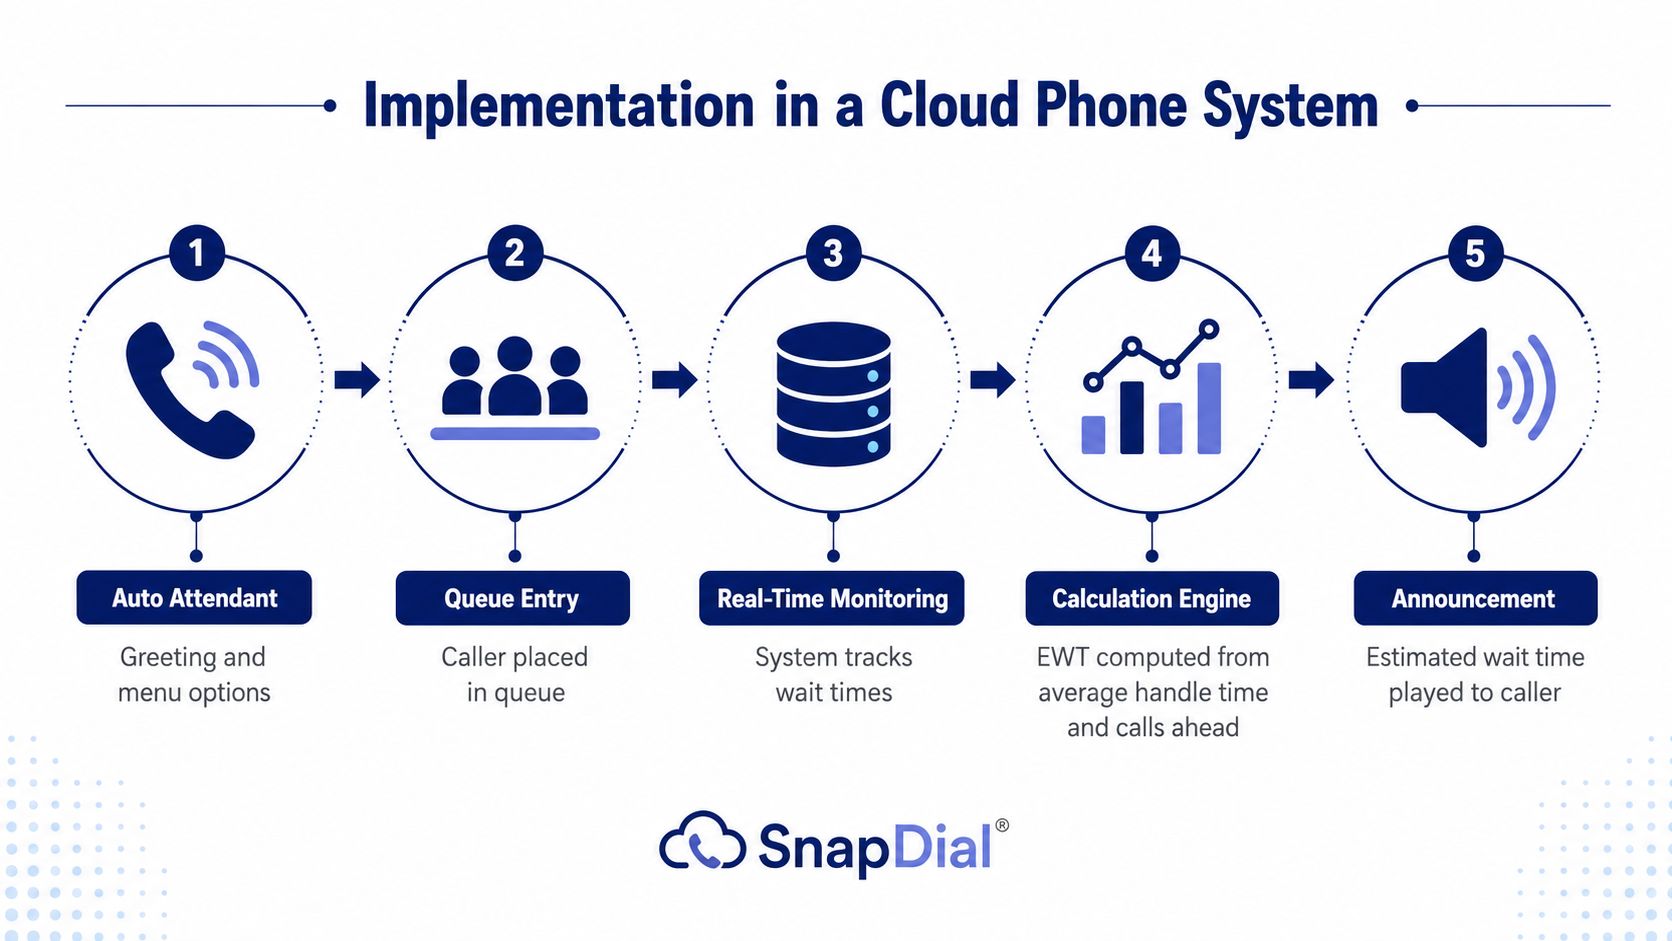
An EWT workflow usually begins before the caller joins the queue. The Auto Attendant greets the caller, gathers the intent through menu choices, and routes the call to the appropriate team. That first classification affects the estimate because a billing queue and a technical queue may have different service times and agent pools.
Follow the data through the call path
In a SnapDial deployment, the smart queue can track callers entering the queue, available and busy agents, service rates, and caller position. The announcement layer then uses that information to play an estimated wait or offer a callback when the wait passes a configured threshold.
Periodic announcements work well when callers need reassurance without constant changes. Position-based announcements help callers understand movement through the line. Skill-based triggers are useful when specialist queues have different staffing rules or escalation paths.
The wallboard should show supervisors the same operational reality that drives the caller message. Watch occupancy to see whether agents are overloaded, abandonment to identify callers leaving before answer, service level to measure timely response, and ASA to compare actual answering performance with the estimate.
Manager's checkpoint: If the caller hears one number and the supervisor sees another, confirm the queue, skill, time window, and refresh interval before blaming the calculation.
Use reporting to find the pattern
Historical reporting turns individual surprises into staffing evidence. Slice EWT and actual answer time by queue, skill, hour, and day. A queue that looks healthy across the day may fail during a specific interval, while a specialist team may need schedule changes rather than more general staffing.
Review unusual spikes with anomaly flag explanations in mind. A sudden change may reflect a staffing event, a routing change, a campaign, or a data-quality issue. The response should depend on the cause.
The following video provides a visual reference for how the announcement and queue experience can be presented:
KPIs and a Practical Optimization Checklist
An estimated wait time program needs measures that connect the caller's announcement with the queue's real performance. Review the core KPIs weekly, then examine them by queue, skill, hour, and day during recurring peaks.
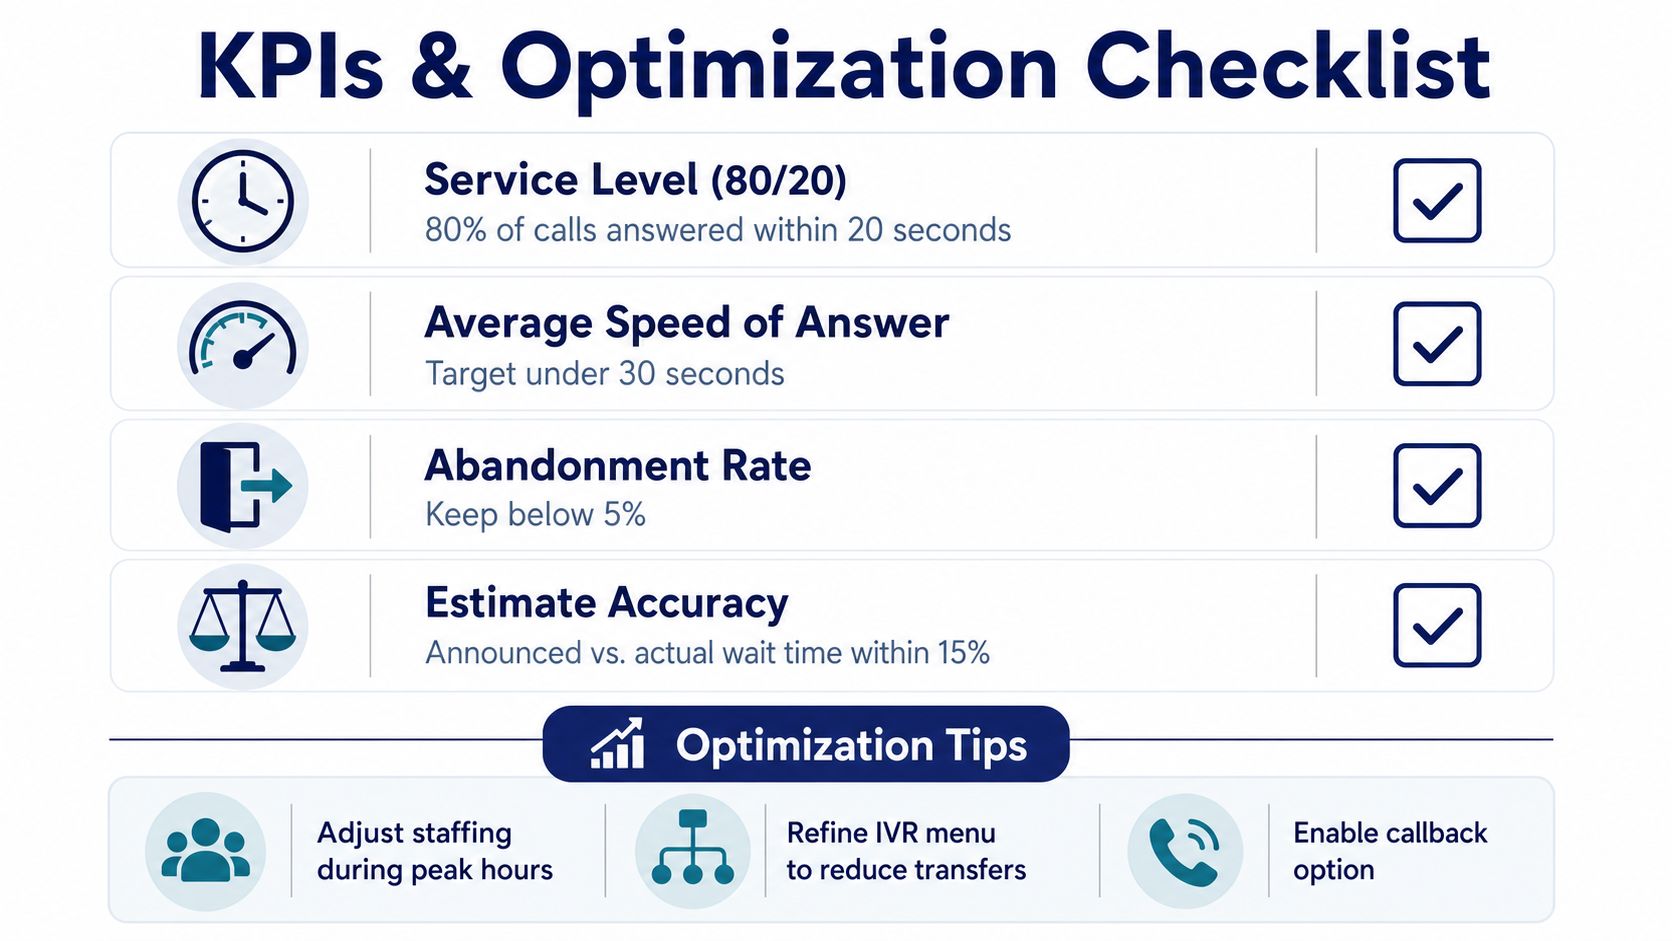
- Service level: Use one operating definition, such as the 80/20 convention shown in the supplied checklist visual. Keep that definition consistent across reporting periods.
- Average speed of answer: Compare actual answer time with announced EWT. ASA is an operational measure of how quickly calls are answered, while EWT represents a forecast presented before connection. The two should be related, but they will not match for every caller.
- Abandonment rate: Track when callers leave, not only the daily total. Risk generally increases as a caller spends longer in the queue, so interval-level results reveal when the announcement or callback offer should change.
- Estimate accuracy: Compare announced wait with actual connect time for each queue and period. A forecast that stays optimistic needs a capacity or buffer adjustment, not a more cheerful script.
Ten actions in impact order
- Validate queue membership: Confirm that calls reach the intended skill group. Incorrect routing distorts both service level and EWT.
- Include after-call work: Add wrap-up time to capacity assumptions so forecasts reflect when agents are available again.
- Check AHT drift: Review handling time by queue and interval. A longer AHT reduces capacity even when call volume is unchanged.
- Match staffing to peaks: Move coverage toward recurring demand surges. This supports service level and reduces delay.
- Separate specialist queues: Prevent broad averages from hiding delays for specialist callers.
- Choose a buffer: Use observed delay variation to set a conservative announcement.
- Refresh updates: Announce meaningful changes without repeating messages so often that callers tune them out.
- Offer callbacks: Present the option when a long wait is likely. This shifts demand away from the live queue.
- Audit routing events: Review transfers, overflow, and shared-agent movement when ASA or EWT changes unexpectedly.
- Compare announced with actual: Report the difference by queue, skill, hour, and day. Use the result to revise staffing, routing, or the buffer.
Review cause and effect together. A lower abandonment rate may come from more callbacks, while improved ASA may follow a staffing change. Record the operational change beside the KPI movement so the team can identify what produced the improvement.
Run a 14-day estimate accuracy audit in SnapDial's reporting module. Compare announced and actual connect times, identify queues where the forecast is consistently high or low, and adjust the announcement buffer until variance stays within plus or minus 15%. Treat this as a management goal from the operating brief, not a universal industry standard.
SnapDial provides cloud phone capabilities including Auto Attendant, smart queue management, queue callbacks, wait-time announcements, real-time statistics, and detailed reporting. Visit SnapDial to review how its system can connect EWT calculations with the caller experience and the supervisor dashboard.