
Real-time reporting is data that becomes trustworthy enough to act on within seconds to a few minutes. It bridges what just happened on a call with what a manager can do about it right now, rather than waiting for an overnight report.
You may already have a wallboard, queue screen, or phone-system dashboard open during the busiest part of the day. The problem isn't whether information appears on the screen. The problem is whether the number is fresh, reliable, and clear enough to support a staffing or routing decision before a customer gives up and hangs up.
That distinction matters for small and mid-sized businesses. A live queue count can show pressure building, but a manager still needs to know whether the count includes calls that have already been answered, whether agent statuses are current, and whether the apparent spike will persist. Real-time reporting is therefore more than fast screen refreshes. It's the operating connection between call events, trusted metrics, and timely action.
The Moment a Manager Sees the Queue Spike
It's Monday at 9:02 a.m. at a six-person HVAC support team. Three calls enter the sales queue inside a minute. The wallboard shows caller wait time moving past ninety seconds, while one agent is still marked ready and another is buried in billing paperwork.
The office manager doesn't need a report about last week's service levels. She needs to decide whether to move the billing agent into the sales queue, change her skill tag, and let the system offer overflow routing before the hold music becomes a customer complaint. She makes the adjustment, watches the queue depth fall, and keeps the billing work visible for later.
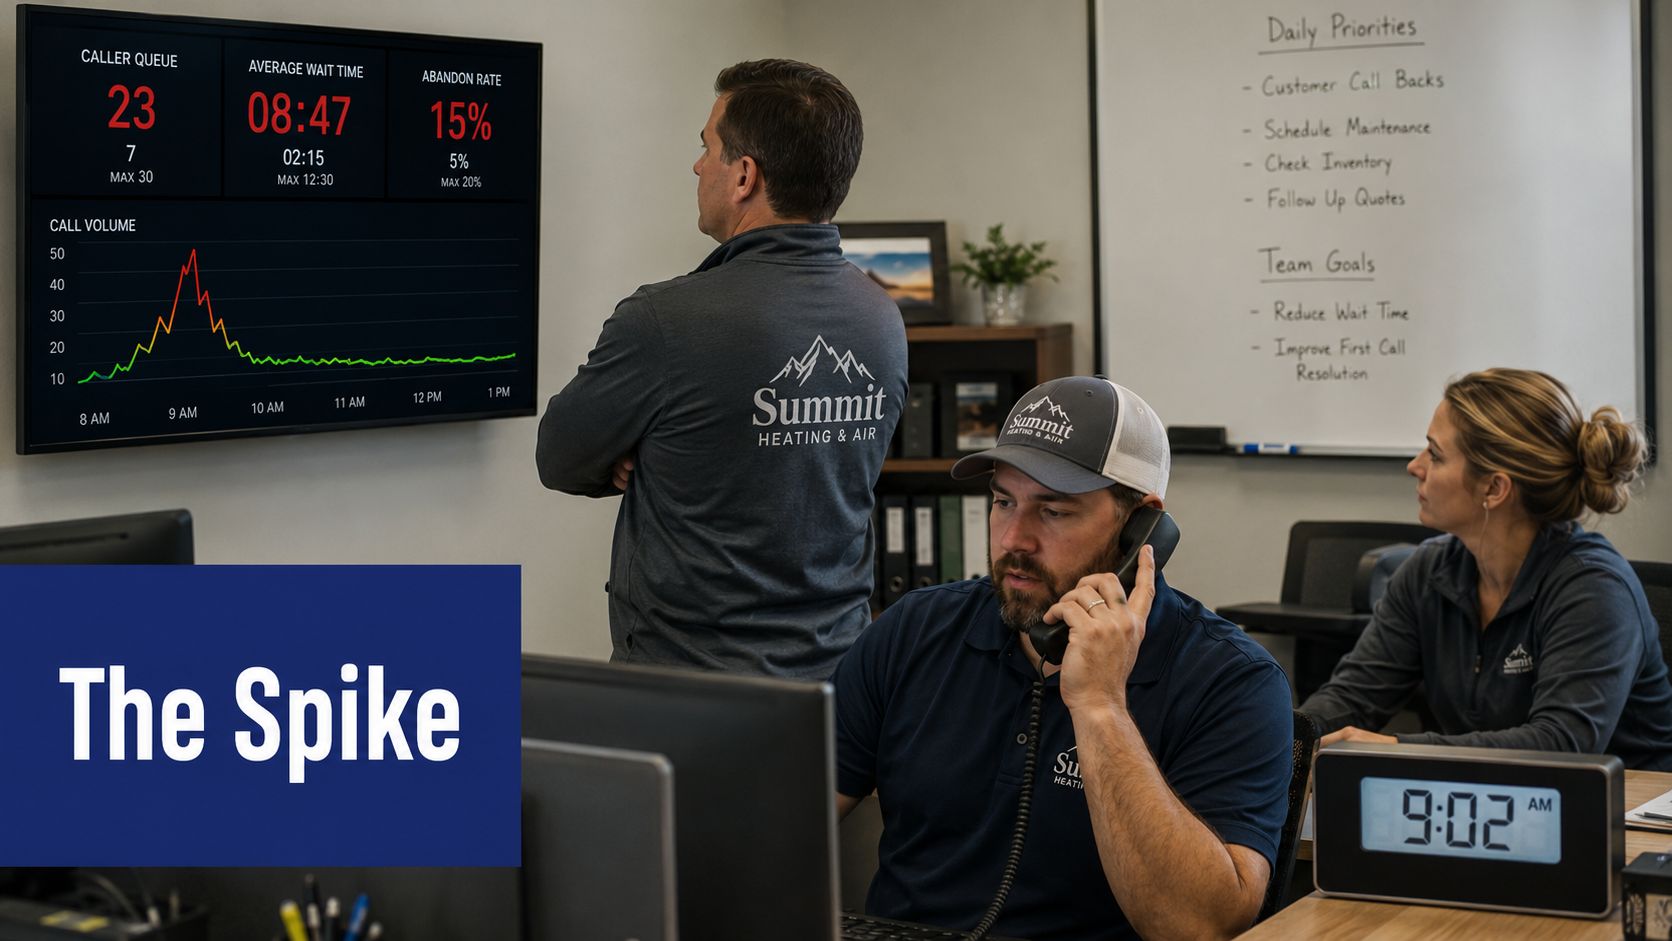
What the manager is actually looking at
The wallboard, live queue view, and agent status panel are familiar tools:
- Wallboard: Displays current queue conditions where the team can see them.
- Queue view: Shows waiting calls, active calls, and available routing capacity.
- Agent panel: Indicates who is ready, ringing, on a call, completing after-call work, or unavailable.
Those screens are only the visible layer. Behind them, the phone system collects events such as a call entering a queue, an agent answering, a transfer occurring, or a caller abandoning the wait. Reporting turns those raw events into operational information.
A manager using call queue management software is trying to close a specific gap: something has already happened in the phone system, and someone needs enough reliable context to respond during the same shift.
Practical rule: A live report earns its place when it helps a person decide who to reroute and whether overflow should be activated.
That's the moment real-time reporting exists for. It isn't an abstract data project. It's the difference between noticing that demand is rising and having enough visibility to protect the next caller.
Defining Real Time Reporting in Plain Language
So, what is real time reporting? It's the practice of collecting, processing, and presenting data within seconds or minutes of generation, so the information becomes usable for an immediate decision rather than a later review. InetSoft's definition of real-time reports describes modern real-time views as having less than two minutes of latency, updating every minute, with configurable windows covering the last 15 minutes, 30 minutes, 1 hour, or 2 hours.
The useful boundary isn't an arbitrary millisecond target. It's decision readiness. If a queue manager can trust a newly updated count soon enough to change routing, the report is serving a real-time operational purpose.
From overnight batches to live events
A legacy batch report works like a morning newspaper. The phone system gathers activity, a scheduled job processes it, and the report arrives later. That model remains useful for trend reviews, payroll checks, and management summaries, but it tells you mostly what already happened.
A live report is closer to a news ticker. When a call enters the queue, the event can appear in the operational view while the situation is still unfolding. The display may represent a current snapshot rather than a final, reconciled account, but it can still support the next conversation or staffing adjustment.
The technology behind that shift is often event streaming. Operational dashboard guidance from Digitarize explains that event-driven architectures can reduce update latency from 24–48 hours in legacy batch systems to sub-second synchronization. That doesn't mean every business needs sub-second reporting. It shows why streaming is technically better suited to live operations than repeatedly asking a batch system whether anything changed.
Data latency versus decision latency
Data latency is how long it takes for a call event to reach a report. Decision latency is how long it takes for a manager to understand the number, trust it, and act.
Those intervals aren't identical. A dashboard can update almost immediately while a reconciliation process, aggregation window, or manual review still affects whether the metric is safe to use. The National Health Information Management Glossary highlights this distinction in financial and expense reporting, where transactions may surface within seconds but practical use still depends on validation and controls.
For a phone system, the immediate questions are usually simple: How many calls are waiting? Which agents are available? Is demand rising on a particular queue or trunk? Real-time reporting connects those answers to a staffing or routing choice.
How the Data Actually Moves
A real-time reporting system is easier to understand as a short path with three layers: sources, pipelines, and surfaces. Think of a faucet releasing call events, a narrow pipe processing them, and a glass that fills often enough for a manager to see the current level.
Sources create the events
The sources are the systems where activity begins. A cloud PBX or private branch exchange can emit records when a call rings, connects, transfers, ends, or enters a queue. An automatic call distributor adds queue and agent events. A CRM, ticketing system, and SIP trunk can contribute related information about the customer, case, or connection path.
These records should carry useful context, such as the queue involved, the agent state, and the event time. If a source doesn't record an event or sends it late, the dashboard can't recover that missing context just by refreshing faster.
Pipelines shape the stream
The pipeline captures incoming events, checks their structure, enriches them with related information, and calculates operational measures. It might count waiting calls, group completions into a small time window, or combine agent status with queue assignments.
A streaming bus can push events through continuously. A lightweight poller can ask a system for recent changes at a short interval. The architectural choice affects freshness, complexity, and resilience. Event streaming is generally better for live operational work because the system reacts to events instead of repeatedly waiting for a scheduled batch cycle.
Surfaces present the result
The surface is what a person sees: a wallboard, browser dashboard, mobile alert, or tile inside a phone-system portal. It may update through a push connection or through short-interval polling.
Latency can hide at several points:
- Network hops: Events may travel through multiple services before processing.
- Clock drift: Systems in different regions may disagree about event order.
- Pipeline backpressure: A sudden burst can create a processing backlog.
- Aggregation windows: The system may wait for enough events to calculate a stable measure.
- Refresh cadence: A dashboard can display old data even when the underlying metric is current.
The phone-system connection becomes simpler when the PBX vendor manages these layers. The customer generally configures which queues and metrics appear, who can view them, and which conditions create alerts. The provider operates the event capture and processing path, while the manager uses the resulting surface to run the shift.
Real Time KPIs That Matter for Phone Systems
A phone dashboard becomes useful when it shows metrics tied to a decision. Queue depth alone may tell you that pressure exists, but agent occupancy can explain whether the team has capacity to respond, and first call resolution can signal whether transfers or repeat contacts are driving demand.
Operational guidance commonly recommends 5–10 second refresh intervals for wallboards and 5–15 second updates for core operational metrics. The call-center analytics guidance from Metropolis also identifies operational reference ranges such as 70–79% FCR, approximately 11.6 minutes AHT, and 75–85% occupancy. These are comparison points, not universal targets.
| KPI Category | Metric | Healthy Range | Action Window |
|---|---|---|---|
| Call-flow health | Queue depth and longest wait | Compare with your normal capacity and service promise | Immediate, then confirm the movement |
| Call-flow health | Average speed of answer | Use the team's established service target | Short live window |
| Call-flow health | Abandonment rate | Watch for a sustained change, not one isolated call | Stabilize before escalation |
| Agent productivity | Occupancy | 75–85% as an operational reference range, per Metropolis guidance | Short live window |
| Agent productivity | AHT | Approximately 11.6 minutes as a reference point, per Metropolis guidance | Use a rolling view |
| Interaction quality | FCR | 70–79% as an operational reference range, per Metropolis guidance | Review over a stabilized sample |
| Interaction quality | Transfer rate | Compare with your queue and call type baseline | Investigate patterns |
| Outcome metrics | Callback commitments and ticket creation | Check completion against promised next steps | Same shift, with validation |
Read the metrics together
Suppose queue depth rises while several agents are marked unavailable. That combination supports a staffing response. If queue depth rises while most agents are already occupied and average handle time is also increased, the manager may need to review call complexity or temporarily adjust routing.
Not every number belongs in the second-by-second view. Agent status and queue pressure can support immediate action. FCR, transfer rate, and AHT usually need a short stabilization window because one unusual interaction can distort the current picture.
A call-center dashboard should place related signals together. The manager should be able to see demand, capacity, and customer outcomes without opening several disconnected reports.
When Live Data Helps and When It Hurts
Faster reporting isn't automatically better reporting. A live number can help a manager reroute a surging queue, bring a logged-out representative back online, or throttle an outbound campaign before customer impact grows. The same number can mislead a supervisor who uses a temporary fluctuation to judge an agent's overall performance.
Match freshness to the decision
Use live data when the decision affects the customer experience almost immediately:
- Queue routing: Move calls before wait times continue climbing.
- Agent coverage: Identify an unexpected unavailable status.
- Overflow control: Send demand to another queue when capacity is constrained.
- Incident response: Investigate a sudden change in call flow or system behavior.
Use a validated, stable report for decisions that describe performance over a longer period:
- Agent scorecards: A single live interval doesn't represent a person's work.
- Coaching plans: Managers need a broader interaction sample.
- Customer SLA reporting: External commitments require agreed definitions and controls.
- Monthly reviews: Leadership needs comparable periods, not a flickering operational snapshot.
Speed creates its own failure modes
A dashboard that changes constantly can encourage overreaction. Supervisors may chase every movement, agents may feel micromanaged, and alert fatigue can cause people to ignore the warning that matters. Partial data can also produce an unstable KPI before its aggregation window closes.
Independent reporting on real-time systems also documents the risk of platform-level outages, a reminder that a “live” view can fail precisely when operators need it. Bold Reports' discussion of real-time reporting tradeoffs makes the stronger case for selective use: stream high-value exceptions and live operations, while keeping less time-sensitive reporting batch-based.
If acting on a number can change a customer's experience within the next ten minutes, put it on a live dashboard. If it can't, a daily or weekly report may be more useful.
Real Time Reporting Inside a Cloud PBX
Inside a self-service cloud PBX portal, real-time reporting should feel like a working control panel rather than a separate analytics project. A manager opens the wallboard and sees current calls, queue depth, and agent status together. The screen answers the first operational question, whether the team can handle the demand arriving now.
Start with the live wallboard
A multi-location owner might filter the view by branch, queue, or team. The owner can compare current conditions across locations during the same shift, while a frontline supervisor sees only the queues and agents assigned to that team.
Clicking an agent tile can reveal the current call state and recent disposition context. Depending on the platform, the supervisor may also have access to routing controls such as a warm transfer option. Those controls matter because the report isn't only describing activity. It can become the place where a manager responds to the activity.
Add queue rules and historical context
The next layer is configuration. A business can define alert conditions for queue overflow or an unusual abandoned-call pattern, then decide who receives the notification. Thresholds should reflect each queue's normal workload, because a sales queue and a technical support queue may require different responses.
Historical filters add context without replacing the live view. A manager can compare the current queue with earlier operating periods, review time-of-day patterns, and distinguish a recurring demand cycle from an unexpected event.
A cloud PBX can also use role-based views. Regional managers may see their assigned locations, while supervisors see only their own teams. That limits clutter and reduces unnecessary exposure to operational data.
For businesses evaluating phone usage reporting, the important design question is whether live and historical reports draw from the same call events. When the PBX owns those events, the portal can support a live wallboard and a later summary without requiring a manual export between systems.
Implementation Choices and Best Practices
A real-time rollout works best when the team starts with decisions, not screens. Ask what a supervisor must change, how quickly that change matters, and what evidence makes the number trustworthy. Those answers determine the refresh cadence, alert logic, validation process, and access model.
Choose cadence by decision speed
A wallboard for queue pressure needs a faster update rhythm than a report used to review call dispositions. Operational guidance places wallboards around 5–10 second refresh intervals and core metrics around 5–15 seconds, as described by Metropolis call-center analytics guidance. Treat those figures as design references, not automatic requirements.
A faster cadence can increase infrastructure demand and visual noise. A slower cadence can hide a change that requires immediate action. The right choice is the shortest reliable interval that matches the manager's decision window.
Set alerts to reduce noise
An alert should answer three questions:
- What changed?
- Why does it matter?
- What should the recipient do next?
Avoid alerts for every small movement. Use conditions that indicate a meaningful operational exception, and give supervisors enough context to distinguish a temporary fluctuation from sustained pressure.
Validate the source before trusting the surface
Before launch, test whether every important event arrives:
- Call lifecycle: Confirm ringing, answer, transfer, completion, and abandonment events.
- Agent states: Check ready, busy, after-call work, and unavailable transitions.
- Time alignment: Compare timestamps across the PBX, queue, CRM, and ticketing system.
- Recovery behavior: Confirm what happens when a connection or reporting service is interrupted.
- Reconciliation: Compare live totals with a later controlled report.
Access controls deserve equal attention. A multi-location business should define what regional managers, supervisors, agents, and administrators can see. Remote teams need the same clear permissions and alert ownership as office-based teams.
Sequence the rollout
Start with a small operational surface instead of publishing every available metric. Instrument the call detail records, identify the queues that affect customer experience, configure a wallboard, and train supervisors to interpret freshness and aggregation windows. Then test alerts during realistic operating conditions, review false alarms, and expand only after the first workflow is dependable.
The objective isn't the fastest possible update. It's the most reliable number a manager can use within the time available for the decision.
Three Rules for Trusting a Real Time Number
Return to the HVAC team at 9:02 a.m. The queue spike is visible, but visibility alone doesn't answer whether the manager should move the billing agent. Three rules help turn a live number into a responsible action.
Rule one is to confirm freshness
Look for the timestamp, last-refresh indicator, and reporting window. A queue count without a freshness signal can make an old situation look current. Check whether the metric includes a meaningful sample or only a few recent events, especially when reviewing abandonment, FCR, transfer rate, or AHT.
The question isn't just, “What does the screen say?” Ask, “When did this data become available, and what period does it represent?”
Rule two is to identify the action
A metric should lead to a defined operational response. Queue depth and agent status may tell a supervisor to adjust routing, redistribute work, or investigate an unavailable representative. A scorecard metric may inform later coaching but shouldn't trigger an immediate judgment about performance.
If nobody knows what to do when the number changes, the metric probably belongs in a historical report rather than the live operating view.
Rule three is to weigh the cost of being wrong
A reversible routing adjustment carries a different risk from a customer commitment or a formal performance decision. The manager can test a temporary queue change, observe the result, and restore the previous setting if conditions normalize. A coaching record or SLA statement requires stronger validation because the consequences last longer.
These rules align data latency, decision latency, and consequence. Real-time reporting earns trust when those three elements match deliberately, not when the dashboard refreshes fastest. The manager at the HVAC team can confirm the queue is current, connect it to a routing action, and choose a reversible response. That's enough information to protect the next caller without pretending that a short live window explains the whole business.
SnapDial provides cloud PBX features including real-time statistics, queue visibility, call routing, and detailed reporting for teams managing live phone operations. Visit SnapDial to see how a cloud phone system can connect current call activity with practical staffing and routing decisions.