
An office manager opens the monthly phone bill and finds charges nobody can explain. The support queue had missed calls, but nobody recorded when they happened. Sales used the most outbound minutes, or perhaps the warehouse did, and no one can say for sure.
That's the problem usage reporting solves. It turns call activity into evidence that people can use for billing, staffing, capacity planning, service quality, and compliance. Instead of treating a phone report as a monthly formality, you can use it to decide which lines need attention, when queues need more coverage, and which records deserve longer retention.
A 2026 report on the data activation gap found that 540+ data practitioners see a disconnect between platform capabilities, operational reality, and business outcomes, as documented by The Modern Data Company's 2026 research. The lesson for a VoIP administrator is straightforward: collecting call data isn't enough. Your team needs a reliable path from raw activity to a specific next action.
Why Your Phone System Data Is Going to Waste
A phone system can produce plenty of information while answering very few useful questions. You may have call logs, voicemail records, queue activity, recordings, and billing details, yet still struggle to explain why customers waited, which department created unusual traffic, or whether a plan matches actual demand.
The difficulty usually starts with the monthly review. Someone downloads a report, scans totals, and files it away. The report describes what happened, but nobody has agreed on what would trigger a staffing change, a routing adjustment, an invoice check, or a retention decision.
From unexplained charges to usable evidence
Consider a company with several locations. The finance team sees a higher phone charge, while the operations manager sees missed calls during a busy period. The IT administrator sees a trunk with heavy activity but doesn't know whether the traffic came from normal sales work, a routing error, or an underused department that was assigned too much capacity.
Usage reporting connects those observations. A useful report can let the team filter activity by user, department, queue, trunk, destination, and time of day. It can also preserve the detail needed to investigate an unusual call pattern instead of forcing someone to guess from a single total.
The practical shift: A report becomes valuable when every important metric has an owner, a decision, and a follow-up action.
The same principle applies beyond VoIP. Microsoft Power BI's usage metrics report keeps 90 days of data, and its total count represents unique reports viewed during that window, as described in Microsoft's usage metrics documentation. That short history can help teams identify recent adoption patterns, but it also shows why administrators must think deliberately about exports and retention when they need a longer record.
What this guide helps you do
You'll learn how to read call-detail records, separate useful KPIs from noise, connect reports to billing and staffing decisions, and investigate patterns inside SnapDial's reporting tools. You'll also see why a smaller set of trusted metrics often beats a wall of dashboards.
The best outcome isn't a prettier chart. It's a clear answer to a practical question: what should the team do next?
What Usage Reporting Actually Means
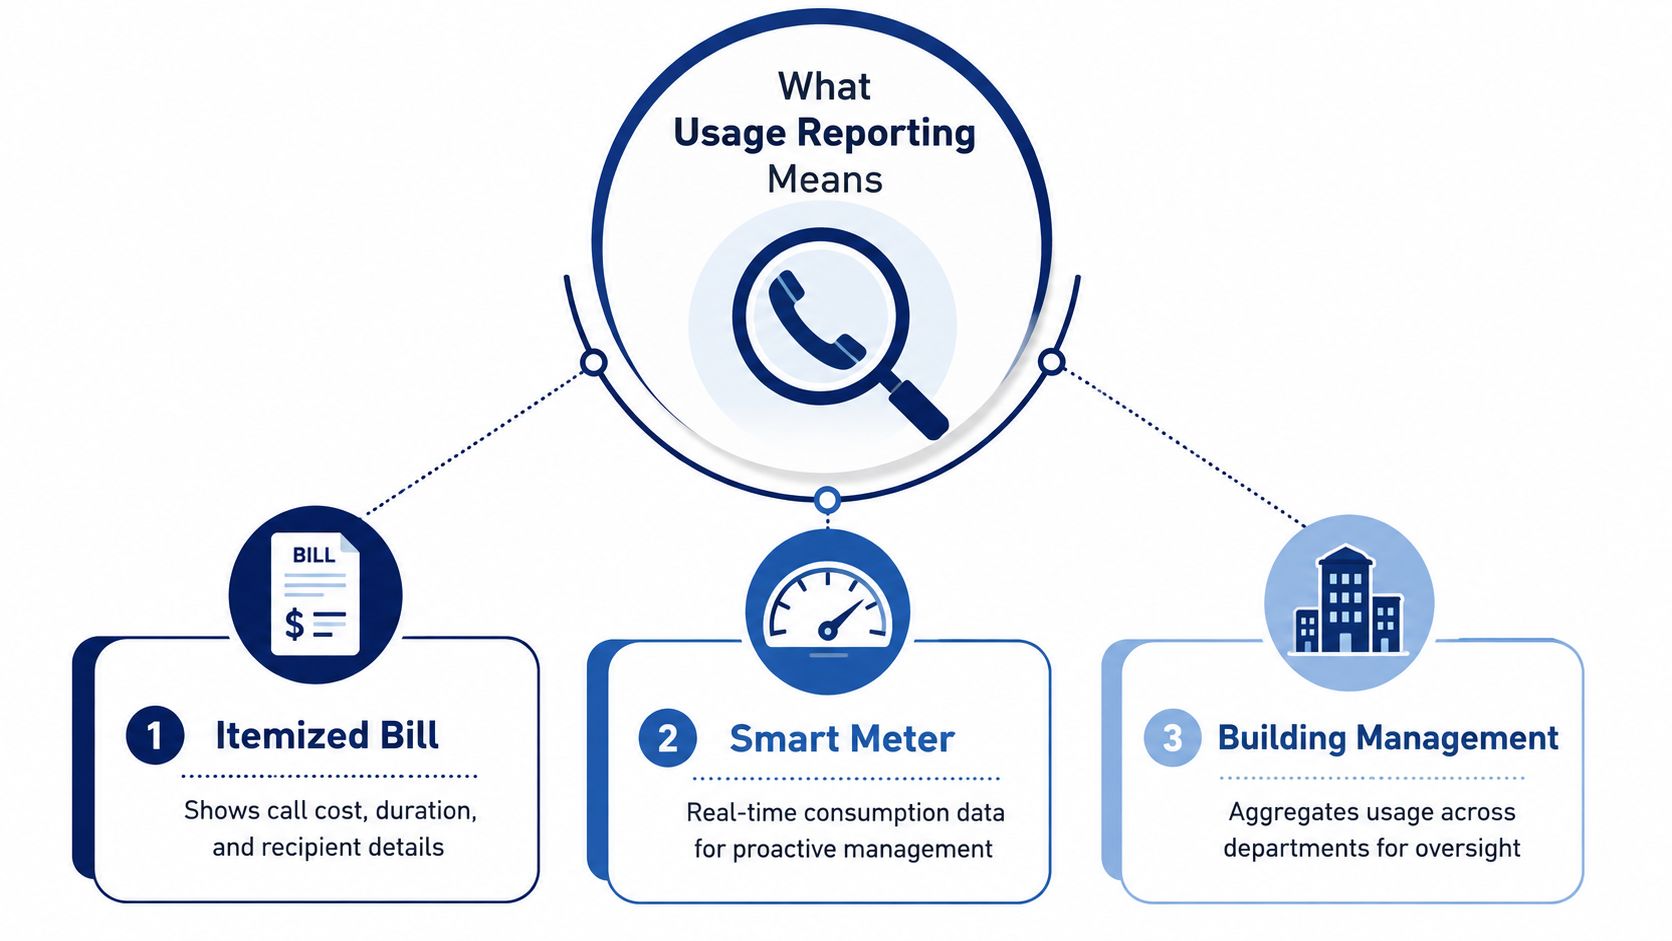
Think of usage reporting as the difference between a building's electricity meter and an itemized utility bill. The meter records consumption as it happens. The bill organizes that activity so someone can understand which period, area, or process created the cost.
A VoIP system works in a similar way. It records call-detail records, commonly called CDRs, along with related activity such as call direction, duration, destination, user, extension, queue, and outcome. Depending on the platform, reporting may also include call recordings, voicemail activity, mobile application use, and other service events.
From raw logs to a decision
A raw log tells you that an event occurred. A structured report helps you compare events and find a pattern.
For example, a CDR might show that an extension handled a call for a particular duration. A report can group that activity by department, compare it with other extensions, show when the calls occurred, and reveal whether the interaction was inbound, outbound, answered, abandoned, or transferred. That grouping is what makes the data useful to a manager.
In telecom and cloud communications, structured CDR analysis can reveal heavy-volume users, underused lines, and unusual traffic spikes that may point to fraud, misconfiguration, or routing problems, according to Vidi Corporation's telecom data analytics overview.
Usage reporting is the organized record of how people use a phone service, shaped so the right person can make a better operating decision.
The three layers to remember
You can use a simple three-layer model:
- Capture: The system records calls, queue events, recordings, voicemails, and related activity.
- Organize: The platform groups and filters those records by user, department, queue, trunk, location, or time period.
- Act: An administrator uses the result to verify a charge, adjust staffing, investigate an anomaly, or preserve evidence.
This is also where broader intelligent reporting for enterprise data becomes relevant. The value doesn't come from collecting every possible field. It comes from structuring information so people can connect an observed event with an operational choice.
A good VoIP report should therefore answer more than “how many calls occurred?” It should help you ask, “Which team handled them, when did demand change, what resource did that affect, and what action is justified?”
The Metrics and KPIs That Matter Most
A cloud PBX can expose many metrics, but they don't all deserve equal attention. Start with the business decision, then choose the smallest group of measures that can support it.
Call volume is the obvious starting point. It counts inbound, outbound, answered, missed, transferred, or abandoned interactions, depending on the report. The clearest signal is demand. A rising volume may require staffing or routing review, while a falling volume may reflect a seasonal pattern, a channel shift, or a service issue.
Average call duration adds context. Volume alone can't tell you whether a department handled many short calls or fewer complex conversations. For finance, duration can support cost allocation. For operations, it can reveal workload that raw call counts hide.
| Metric | What It Measures | Primary Use |
|---|---|---|
| Call volume | Number and direction of interactions | Billing and workload |
| Average call duration | Typical time spent on calls | Cost allocation and productivity |
| Department cost allocation | Usage associated with a team or location | Billing and budgeting |
| Trunk and line utilization | Demand placed on shared phone resources | Capacity planning |
| Abandonment rate | Abandoned interactions divided by offered interactions | Staffing and queue design |
| Average wait time | Total wait time divided by interactions | Service performance |
| Average handle time | Interaction time plus related handling work | Staffing and process review |
| First-call resolution | Whether the customer's need was resolved in the initial interaction | Quality and support workload |
| After-call work | Time spent documenting or completing follow-up | Staffing and workflow design |
| Recording usage | Calls recorded, stored, accessed, or retained | Compliance and quality |
| Mobile app activity | Calling activity through mobile endpoints | Remote-work visibility |
For contact-center reporting, Webex's call center reporting guide identifies abandonment rate, average wait time, average handle time, first-call resolution, and after-call work as actionable measures. Many platforms define abandonment rate as abandoned count divided by offered count, which makes the KPI useful for capacity planning rather than simple historical description.
Read the cause, not just the symptom
Suppose abandonment rises at a particular time. The cause could be too few agents, long handle times, slow after-call work, or routing that sends too much demand to one group. Segmenting by queue, hour, and agent group helps distinguish those possibilities.
Small changes in handle time or after-call work can create longer queues during busy intervals, particularly when distributed teams have uneven coverage across shifts. That's why a support manager should review related KPIs together instead of reacting to one alarming number.
For teams setting broader objectives, an essential OKR metrics guide can help connect operational measures to outcomes. In a VoIP environment, that means linking a queue metric to a service goal, not tracking it because the dashboard happens to display it.
Teams that need a focused reference can also review call center KPIs and choose measures that correspond to staffing, customer experience, or workload decisions.
How Usage Reporting Pays for Itself
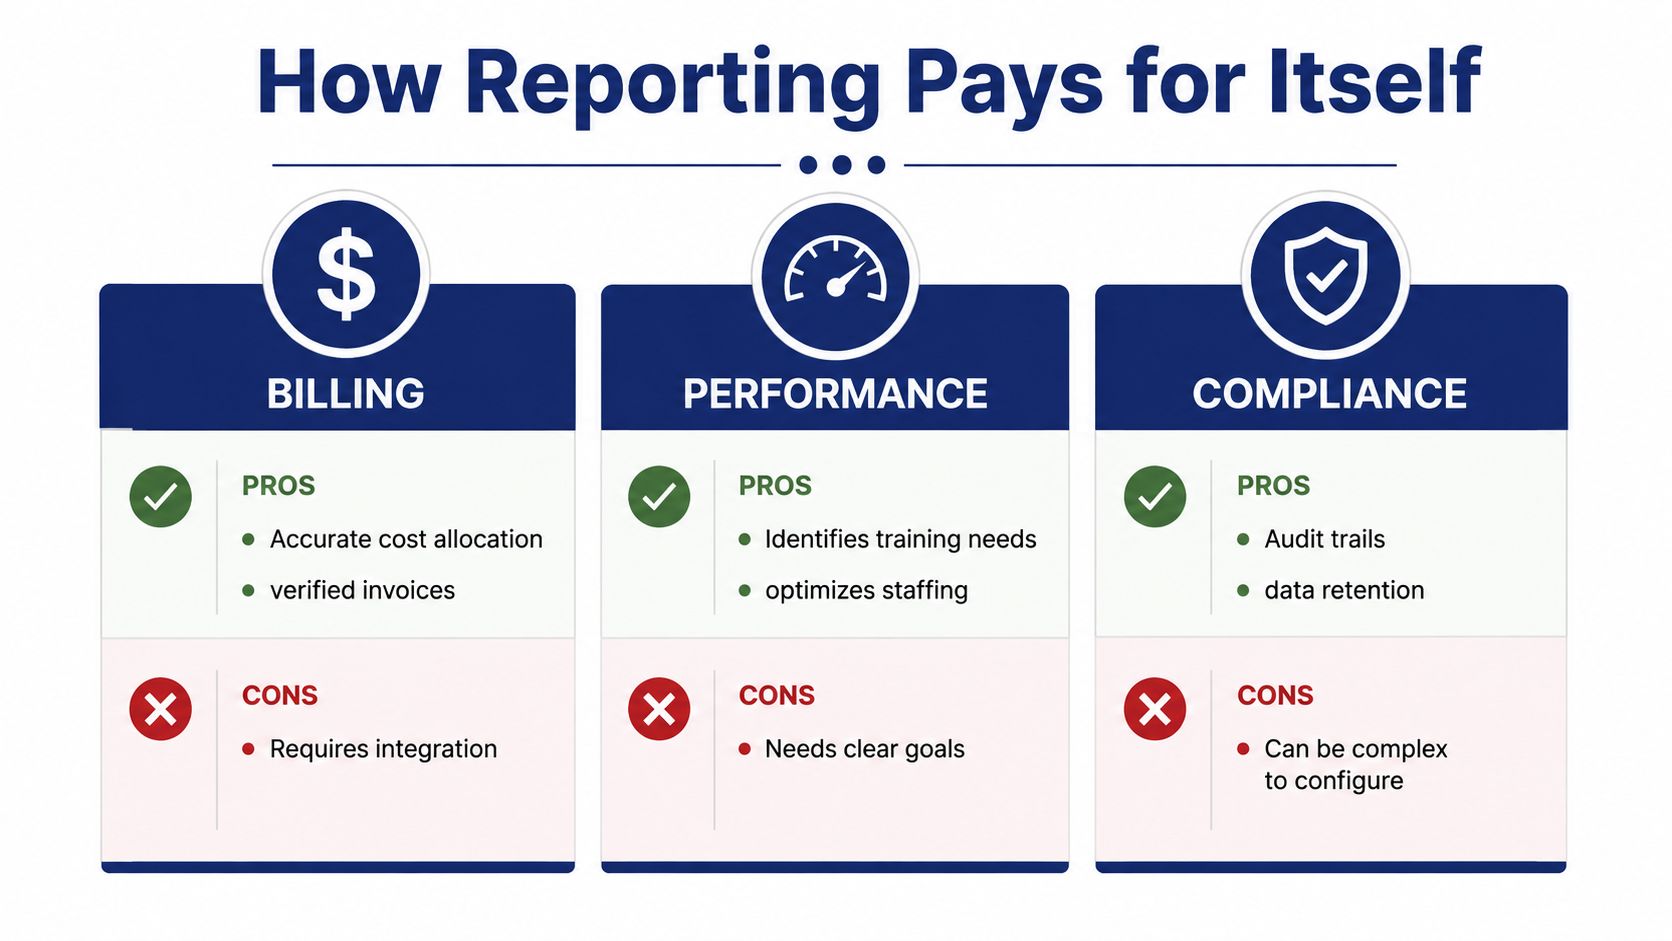
A single usage record can support three different decisions, but each decision needs a different view of the data.
Billing asks: Do charges or internal allocations match actual usage? A multi-location company can group calls by department, site, or client, then compare those totals with expected charges. If finance sees an unexpected change, an administrator can inspect the call activity before approving or disputing an invoice.
Optimization asks: Do capacity and routing match demand? A report might show an underused line at one location while another department places steady pressure on a shared trunk. The appropriate response could be a routing change, plan review, or capacity adjustment. Reporting does not choose the answer, but it gives the team evidence for choosing one.
Compliance asks: Can the organization account for an interaction and manage its records responsibly? Call recordings, access history, and usage records need clear ownership and retention rules. Reporting creates an auditable trail when the organization configures access and storage to meet its own obligations.
One report, three decisions
A support team might use queue data to identify longer lunchtime waits. Operations can use that pattern to adjust coverage, while finance can examine department-level activity to understand the effect on resource allocation. The same records create value only when each group connects them to a decision.
Purpose determines the report design. Billing needs dependable grouping and reconciliation. Performance analysis needs queue and time segmentation. Compliance review needs controlled access, traceability, and a clear approach to retention.
SnapDial reports can help administrators connect these views by organizing call activity for the question at hand. A billing review may focus on departments and sites. An operations review may compare demand with available coverage. A compliance review may focus on who accessed records and whether the handling process can be explained later.
Start with the cost of uncertainty. An invoice discrepancy may consume repeated staff time. An unbalanced trunk may lead to avoidable capacity spending. A queue pattern that remains unexplained can affect service decisions for weeks.
A report pays for itself when it replaces a recurring guess with a repeatable decision.
The return may come from preventing an unnecessary purchase, finding an invoice discrepancy, improving queue coverage, or showing an auditor how an interaction was managed. The benefit is not always a direct saving. Often, it is the time and confusion the organization avoids by turning raw call activity into an agreed action.
Reading SnapDial Reports Like a Pro
Start in the summary view, but don't stop there. A total can tell you that a pattern exists. The drill-down tells you where to look and what to change.
SnapDial's self-service web portal is designed for administration tasks such as managing users, reviewing call logs, handling voicemails, and accessing recordings. Its call center capabilities include smart queue management, queue callback, wait-time announcements, real-time statistics, and detailed reporting, giving administrators several ways to connect queue activity with service decisions.
Example one, a lunchtime abandonment spike
Suppose a queue shows more abandoned calls during lunch. Don't immediately conclude that the team needs more people.
First, compare offered, answered, and abandoned interactions by hour. Then separate the result by agent group and review average wait time. If wait time rises across the queue, coverage may not match demand. If only one group shows the problem, routing or shift coverage may be uneven.
Next, examine average handle time and after-call work. Agents may be available on paper but spending too long completing records after each interaction. Queue callback can also change the pattern, because callers who accept a callback may no longer appear as abandoned in the same way as callers who disconnect without that option.
The point is to move through the report in a fixed order:
- Summary: Confirm the unusual pattern.
- Time segment: Find the hour or interval where it appears.
- Queue segment: Identify the affected service line.
- Agent segment: Check whether coverage or handling differs.
- Action: Adjust staffing, routing, announcements, callback rules, or workflow.
Example two, a department using a trunk heavily
For a department with high trunk activity, begin by separating inbound and outbound calls. Filter by user and time of day, then check whether the pattern is concentrated in a legitimate workflow or spread across unexpected destinations.
An unusually high total may reflect normal sales work. It may also indicate a routing issue, misconfiguration, or traffic that deserves investigation. Reviewing the detailed CDR call detail record gives the administrator the event-level context needed to distinguish those cases.
Use the same habit for recordings and mobile activity. Ask who generated the activity, when it happened, what business process it supported, and whether the record needs action or retention. A report becomes easier to trust when every drill-down follows a consistent question sequence.
Avoiding Reporting Fatigue and Dashboard Noise
More reporting doesn't automatically create better decisions. A team can add filters, alerts, charts, and event types until the dashboard contains everything, then discover that nobody knows which signal matters.
Granular data becomes difficult to interpret when teams use different definitions. One manager may call a call “answered” after a transfer, while another counts only the first agent response. Without shared definitions, two reports can be technically accurate and still lead to different conclusions.
Analytics governance guidance recommends that teams audit reports regularly, retire unused events, and refine dashboards as goals change, because added detail can reduce clarity without shared definitions or a consistent semantic model, as discussed in DealHub's usage analytics glossary.
Keep the operating set small
Choose metrics because someone will act on them. Answered rate by queue may deserve regular attention if it affects staffing. Callback success may matter if the team uses callbacks to recover demand. An abandoned-call spike may need an alert when managers can respond during the affected period.
Other measures can stay in periodic reviews. A detailed destination breakdown may be valuable for billing or fraud investigation but unnecessary as a live alert. Recording storage activity may belong with compliance and administration rather than the daily operations screen.
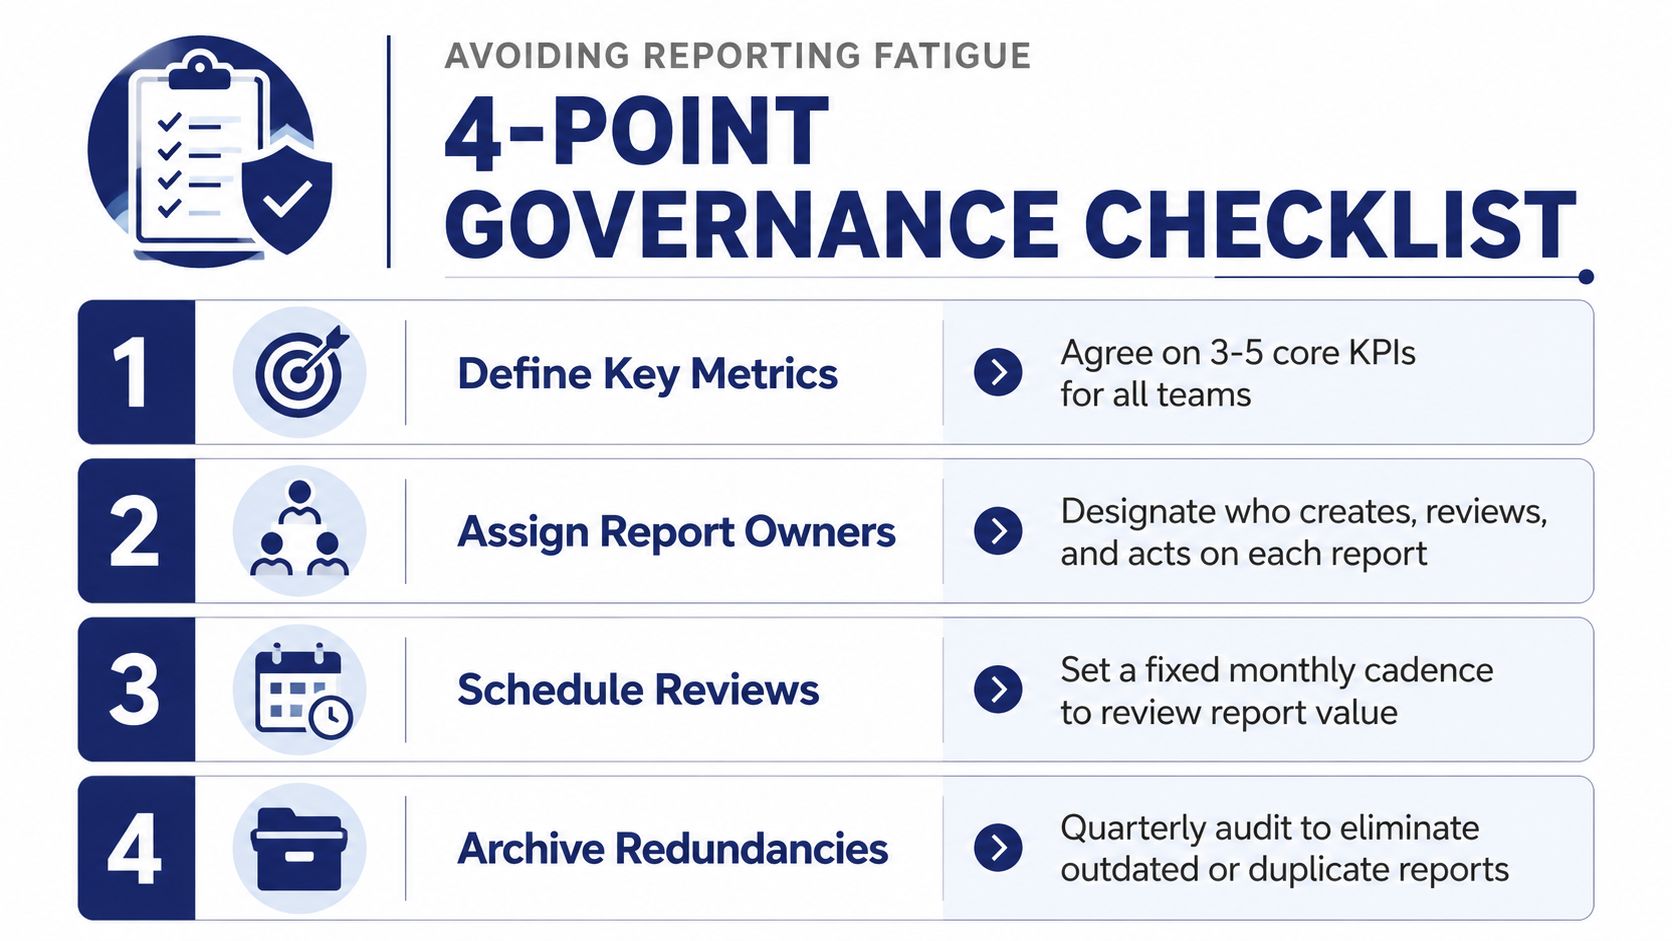
A practical governance routine includes:
- Define shared metrics: Write down what each KPI includes and excludes.
- Assign report owners: Name the person responsible for review and action.
- Schedule value checks: Remove reports that no longer support a decision.
- Separate alerts from analysis: Reserve urgent notifications for patterns that need timely intervention.
Treat AI insights as prompts
Usage reporting is moving toward real-time, AI-assisted, and embedded analytics, with users increasingly expecting reports to recommend what should happen next, as described in The Reporting Hub's analytics trend review. That direction can help administrators spot patterns faster, but an automated finding still needs validation.
Check the underlying calls, the time range, the segmentation, and the metric definition before changing staffing or routing. AI can identify a useful lead. A human should confirm the context and own the decision.
For teams working with queue dashboards, call center dashboards are most useful when they support that disciplined process, rather than adding another screen no one reviews.
Your First 30 Days of Usage Reporting
Begin with a baseline, not a complicated dashboard. Export call logs, queue statistics, and the records relevant to billing or compliance. Keep the original export so you can compare future reports against a known starting point.
Choose two or three metrics tied to real decisions. For a support team, that could be abandonment, average wait, and average handle time. For a multi-location business, it might be department usage, trunk utilization, and unusual destination activity.
Set alerts only for those priorities. An alert should identify the condition, show the affected queue or department, and point to an owner who can investigate. If nobody knows what to do after receiving an alert, it belongs in a scheduled review instead.
Use the first month to build a simple operating rhythm:
- Days one through seven: Export the baseline and confirm the definitions of each selected KPI.
- Days eight through fourteen: Segment activity by user, queue, department, and hour to locate meaningful patterns.
- Days fifteen through twenty-one: Connect findings to an action, such as a staffing adjustment, routing review, invoice check, or recording policy review.
- Days twenty-two through thirty: Review what changed, archive low-value reports, and schedule the next recurring review.
Where it helps, move exports into a spreadsheet, billing workflow, CRM, or approved reporting system. Integration matters because usage data shouldn't become another isolated file that nobody owns.
The direction of usage reporting is clear. Teams increasingly want dynamic analytics that explain the next step, not just a historical summary of activity. Start small, define the action first, and expand only when the additional detail improves a real decision.
SnapDial provides a cloud-based business phone system with call logs, recordings, mobile calling, queue management, real-time statistics, and detailed reporting for teams that need clearer visibility into phone activity. Visit SnapDial to explore a managed VoIP setup that can connect everyday calling data with practical billing, staffing, and service decisions.