
The most popular advice about contact-center performance is often the most dangerous: make calls shorter, keep agents busy, and treat rising productivity as proof that the operation is improving. That approach can produce attractive dashboards while customers call back, agents transfer difficult cases, and supervisors lose sight of whether anyone solved the original problem.
Agent performance metrics should answer a more useful question: did the team resolve the customer's need accurately, efficiently, and sustainably? Average Handle Time matters, but only when interpreted alongside resolution, quality, workload, customer effort, and the systems that supported the interaction. A balanced scorecard exposes trade-offs that a single productivity number hides.
Why Traditional Call Center Metrics Fall Short
Contact centers historically focused on operational efficiency. Leaders watched speed to answer, call duration, cost per interaction, abandonment, and agent activity because these figures were easy to collect and connect to staffing decisions. ContactBabel's U.S. benchmarking research also identifies customer satisfaction and Net Promoter Score as among the most important contact-center measures, alongside operational indicators such as first-call resolution, transfer rate, and abandonment in its service and sales benchmarking report.
The problem isn't using efficiency metrics. The problem is allowing one of them to become the definition of good work. A low Average Handle Time can mean an agent understands the issue and resolves it quickly. It can also mean the agent rushed the conversation, transferred the caller, skipped documentation, or failed to solve the problem. The dashboard records a short interaction, but it may not record the cost of the customer's next contact.
Efficiency is not the same as resolution
AHT should sit inside a wider operating model. Speed to answer helps customers access the team, but it doesn't prove that the team helped them. Occupancy shows how much of an agent's logged-in capacity is occupied, but it doesn't show whether the workload is sustainable. Even cost per interaction becomes misleading when cheaper contacts create more repeat work.
The same risk applies to answer speed. A queue may answer quickly during one interval because agents are handling contacts continuously, then deteriorate when demand spikes or after-call work accumulates. Daily averages can make that pattern look stable even when customers experience brief periods of severe delay.
Operational rule: A metric is useful only when the team can connect a change in that metric to a management action.
Build reporting around customer outcomes
A balanced scorecard combines real-time service indicators with outcome and quality measures. The first group helps managers protect capacity and service levels. The second group shows whether the contact produced a good result.
For distributed and hybrid teams, detailed call logs, recordings, routing history, queue data, and after-call work records make comparisons more consistent across locations. They also reveal when an agent's result reflects the queue rather than individual skill. Someone handling routine account maintenance faces different resolution conditions from someone handling complaints or technical support.
Managers building broader measurement systems can also benefit from ELECTE's guide to unusual AI metrics, particularly when automation handles part of the customer journey. The underlying lesson applies to human-agent operations too: track the measures that explain whether the system created value, not only the measures that are easiest to count.
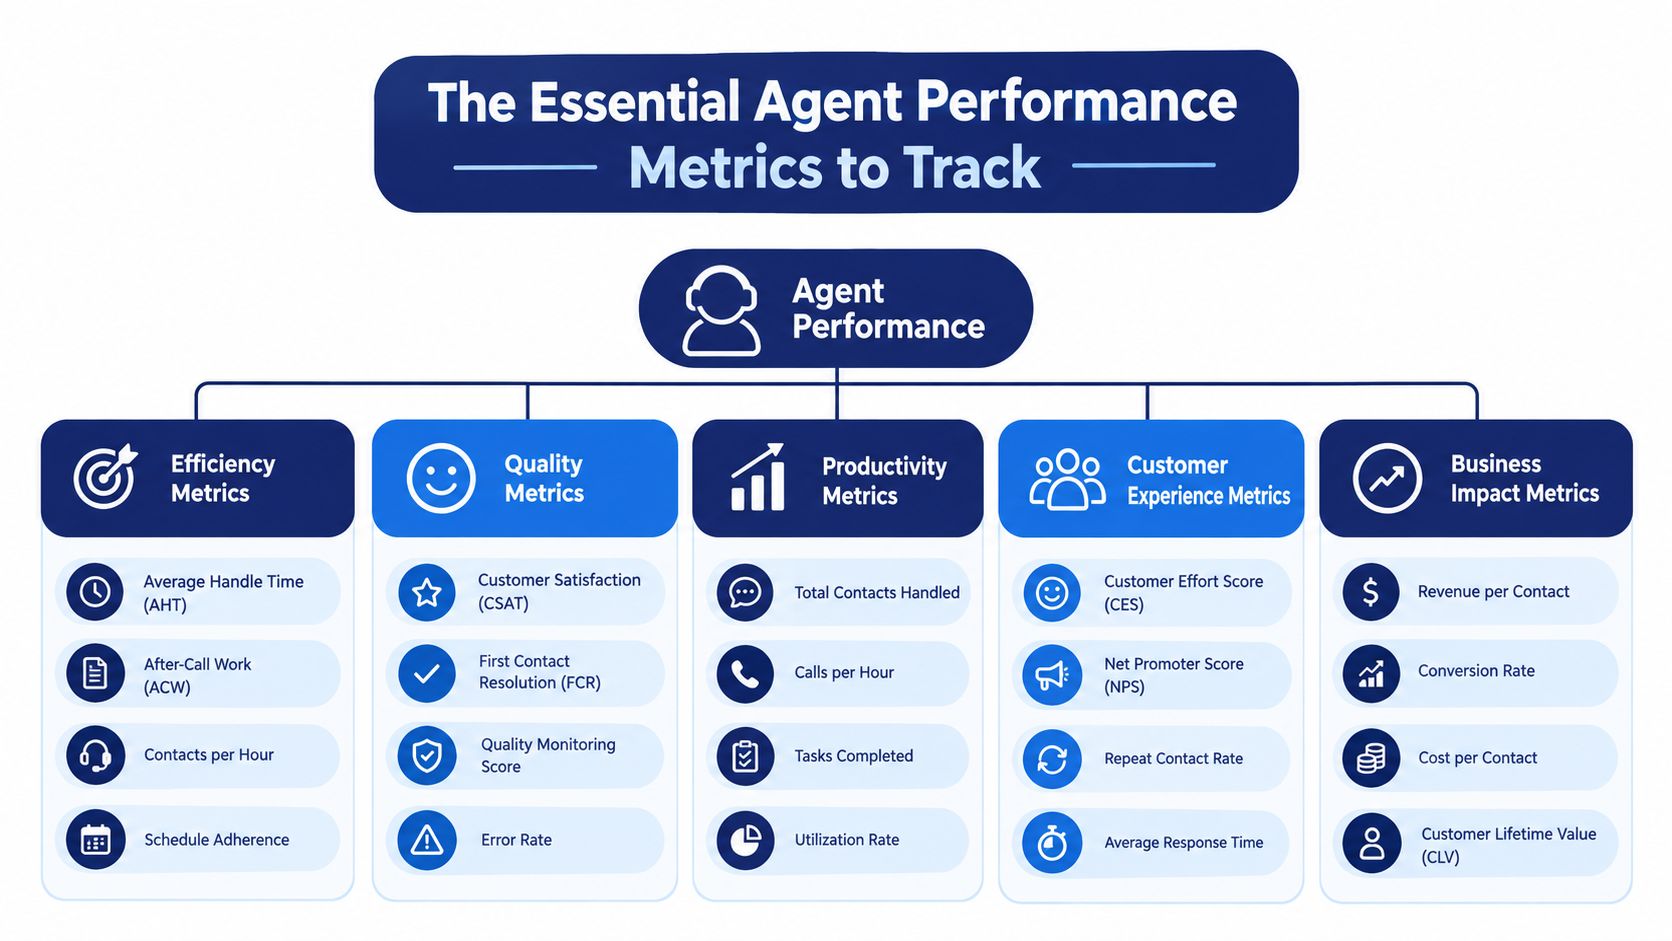
The Essential Agent Performance Metrics to Track
A practical scorecard needs enough detail to diagnose performance without overwhelming supervisors. Start with four groups: efficiency, capacity, outcomes, and quality. Each group answers a different question, and none can replace the others.
Efficiency metrics
Average Handle Time is calculated as talk time plus hold time plus after-call work. It helps with staffing and workflow analysis, especially when segmented by reason code and complexity. It shouldn't be used as a universal speed target because a complex, correctly resolved interaction may take longer than a simple inquiry.
Transfer rate reveals how often an agent moves responsibility to another person or queue. A high rate may indicate poor training, weak routing, unclear authority, or a legitimate need for specialist support. Pairing transfer data with FCR and quality reviews distinguishes appropriate escalation from avoidance.
After-call work shows how much time agents need to document, code, or complete follow-up tasks. A reduction can indicate better forms or stronger workflows, but it can also indicate incomplete records if quality reviewers find missing details.
Capacity and sustainability metrics
Occupancy measures the share of logged-in time an agent spends handling contacts rather than waiting. Schedule adherence measures whether the agent is available when scheduled, not merely whether they were available at some point during the day.
ICMI guidance places sustainable occupancy roughly in the 75% to 85% range, and warns that occupancy above 85% can increase fatigue and harm other KPIs in its contact-center metrics guide. Managers should treat these measures as capacity controls. When occupancy approaches saturation, agents lose recovery time, after-call work piles up, and service quality becomes more vulnerable to demand spikes.
Outcome metrics
First-Contact Resolution, or FCR, measures whether the customer's issue was solved during the initial interaction without repeat contact. It's one of the clearest checks on whether speed produced a useful result.
Track repeat-contact rate, escalation rate, and abandonment beside FCR. A team that lowers AHT while repeat contacts rise hasn't improved the customer journey. It has shifted work into another part of the operation.
Quality and experience metrics
Quality-assurance scores assess the interaction against a calibrated rubric. The rubric might cover verification, discovery, accuracy, compliance, communication, documentation, and resolution. Customer satisfaction adds the customer's perspective, while complaint rate and effort feedback expose problems that a call review may miss.
An independent ISG survey found that 78% of organizations tracked AHT, compared with 69% tracking quality-assurance scores, 61% tracking customer satisfaction, and 46% tracking FCR in its agent productivity research. That distribution shows why managers should resist building a scorecard around the most commonly used metric. For additional KPI definitions and reporting considerations, see this practical guide to call-center KPIs. A broader B2B and SaaS agent productivity guide can also help teams connect individual activity with wider operational results.
How to Calculate and Segment Your Data
A formula creates consistency, not truth. The truth appears only after managers compare similar work under similar conditions. AHT calculated across every queue may be mathematically correct and operationally useless if one team handles password resets while another handles technical failures.
Use a common data model for every interaction. Capture the queue, reason code, channel, complexity, customer type where relevant, transfer path, agent tenure, disposition, resolution status, and whether automation handled part of the journey. Keep the definitions stable so a change in reporting doesn't look like a change in performance.
Core formulas and comparison rules
| Metric | Formula | Critical segments |
|---|---|---|
| Average Handle Time | Talk time + hold time + after-call work, divided by handled contacts | Reason code, channel, complexity, queue, agent tenure |
| First-Contact Resolution | Contacts resolved on the initial interaction, divided by total contacts | Contact type, queue, location, agent, issue complexity |
| Occupancy | Handling workload divided by staffed logged-in capacity | 30-minute interval, queue, location, staffing plan |
| Schedule adherence | Time available at scheduled times, compared with scheduled availability | Interval, shift, meeting time, training, absence reason |
| Transfer rate | Transferred contacts divided by handled contacts | Transfer destination, reason code, agent tenure, queue |
| Repeat-contact rate | Customers or cases with a repeat contact within the defined observation window, divided by total resolved contacts | Issue type, channel, agent, automation path |
| Quality score | Weighted rubric points earned, divided by available rubric points | Reviewer, rubric category, queue, contact type, agent tenure |
| Customer satisfaction | Positive or average survey responses using the organization's defined survey method | Channel, queue, issue type, response source |
The FCR formula needs a precise resolution rule. A contact shouldn't count as resolved merely because an agent selected a favorable disposition. Use follow-up contacts, reopened cases, or customer confirmation where the workflow supports them.
Use intervals to find operational strain
Calculate occupancy and adherence in 30-minute intervals, not only as daily averages. A daily occupancy figure can conceal a short overload period that produced missed calls, long waits, rushed conversations, and burnout. Compare each interval with queue demand, staffing, abandonment, wait time, FCR, and QA results.
Segment AHT before coaching an agent. A high average may reflect complex contacts, new-hire learning, translation needs, system delays, or a queue with frequent escalations. A low average may reflect premature transfers or incomplete troubleshooting. The right comparison is usually an agent against peers handling the same work, not an agent against an organization-wide average.
Use SnapDial usage reporting or an equivalent reporting layer to preserve the underlying interaction detail. Supervisors need to move from an aggregate result to the calls, queues, and time intervals that produced it.
Understanding Industry Benchmarks and Context
Managers often ask for a single answer to “What is a good number?” That question is understandable, but it can produce poor targets. A benchmark is useful as a reference point, not as a verdict on every agent and queue.
SQM Group's 2024 FCR benchmark, reported in 2025, placed the all-industry average at 69% in the benchmark summary. SQM classifies 70% to 79% as a good performance range and 80% or higher as world-class, while only about 5% of centers reach that top level. Those figures provide orientation, but they don't remove the need for segmentation.
The queue changes the meaning of the number
SQM's results varied substantially by contact type:
- General inquiries reached 73% FCR, while account maintenance reached 72%.
- Orders reached 71%, and billing reached 69%.
- Claims reached 61%, while technical support reached 60%.
- Complaints reached only 48%.
Each figure has the same denominator concept, but the work is not equivalent. A general inquiry may require a known answer and little investigation. A complaint may involve history across channels, policy limits, an earlier failed interaction, or an outcome the agent can't authorize. A technical issue may depend on a product team, system access, or troubleshooting steps outside the agent's control.
Set targets by work type
An organization-wide FCR target can create two bad outcomes. Leaders may penalize agents in complex queues for conditions they can't control, or they may allow strong performers in simpler queues to appear average because the total company figure hides their results.
Use benchmarks to frame questions:
- Is the queue improving against its own historical baseline?
- Does the target reflect the contact type and complexity?
- Can agents access the customer history and knowledge needed to resolve the issue?
- Do agents have authority to complete the resolution without unnecessary escalation?
- Are routing, staffing, and automation changing the composition of the queue?
A benchmark should start an investigation, not end one.
The same principle applies to AHT, occupancy, QA, and satisfaction. Compare like with like, then examine the trade-offs. If FCR rises while AHT also rises, the longer conversations may be producing better outcomes. If AHT falls while repeat contacts increase, the apparent efficiency is probably false.
Common Measurement Pitfalls and Blind Spots
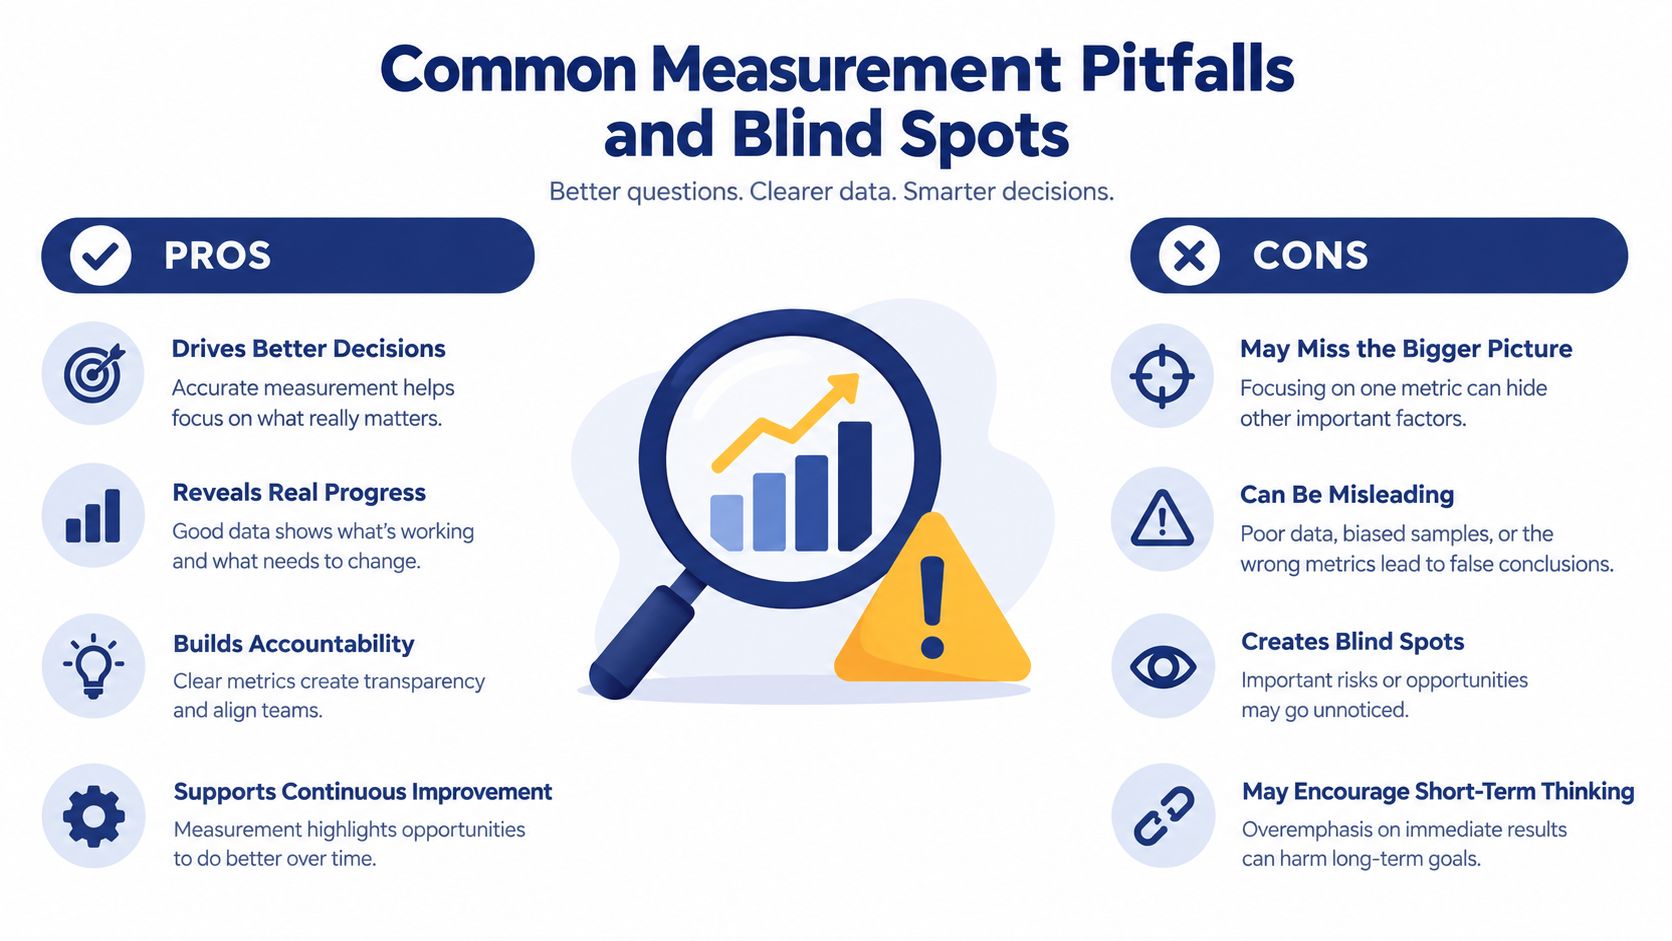
Poorly designed scorecards don't merely fail to explain performance. They can actively train people to behave in ways that damage the customer experience.
The classic example is the isolated AHT target. An agent learns that shorter calls receive praise, so the agent reduces discovery questions, gives a partial answer, transfers difficult customers, or closes the interaction before confirming the outcome. The dashboard improves immediately. The customer's problem may not.
Find the mismatch between speed and quality
One of the strongest diagnostics is a cross-metric exception report. Flag agents whose AHT is below the team median while FCR, QA, or CSAT is materially worse than the comparable peer group. That combination suggests premature transfers, rushed troubleshooting, weak documentation, or an interaction that ended before the customer's need was understood.
The opposite pattern matters too. An agent with high AHT and strong FCR and QA may not need pressure to talk faster. That agent may be handling complex contacts or compensating for poor knowledge tools, slow applications, or weak routing. Coaching should target the cause, not the number.
Give automation fair credit
AI, IVR, transcription, callbacks, self-service, and routing systems now influence the customer journey before an agent joins the conversation. Traditional agent metrics can assign the result to the wrong contributor.
A shorter call may reflect successful pre-call automation. A higher FCR may reflect better intent recognition or a more capable knowledge base. A transfer may result from routing logic rather than agent judgment. Managers need an assisted-resolution view that records what automation attempted, what information it passed forward, and what the human agent ultimately completed.
Recent ICMI data reports that 84% of contact centers measure AHT and 74% measure agent productivity, while only 14% measure deflection and 13% measure self-service accessibility in its 2025 measurement research. The gap creates a blind spot for businesses that want to evaluate human-AI collaboration fairly.
Track team outcomes alongside individual outcomes:
- Assisted resolution: What portion of the customer's objective did automation complete before handoff?
- Customer effort: How many steps, explanations, or repetitions did the customer need?
- Escalation quality: Did the handoff include accurate context and a clear reason?
- Knowledge reliability: Did the agent receive information that was complete and correct?
- Repeat contact: Did the combined automated and human journey prevent another interaction?
The scorecard should encourage agents to use automation well, not compete against it. A system that assigns every result to the last human touchpoint will produce distorted coaching and weak investment decisions.
Actionable Strategies for Performance Improvement
Measurement improves operations only when it changes what supervisors do next. Start each coaching conversation with a pattern across metrics, then inspect the underlying calls and workflow.
Coach the combination, not the isolated result
An agent with high AHT, strong FCR, and strong QA may need better search, clearer knowledge articles, faster system access, or routing to a specialist queue. Shortening the calls without fixing those constraints can lower resolution.
An agent with low AHT and weak FCR needs a different intervention. Review discovery, troubleshooting depth, transfer behavior, documentation, and closing questions. Give the agent a small number of observable behaviors to practice, then review whether the outcome changed.
Match the intervention to the defect
- Low FCR with acceptable QA: Investigate knowledge gaps, authority limits, routing, and repeat-contact causes.
- Low QA with normal AHT: Review compliance, accuracy, empathy, documentation, or process adherence.
- High transfer rate: Check queue design, escalation rules, specialist access, and agent confidence.
- High occupancy with falling quality: Revisit staffing, interval coverage, breaks, coaching time, and after-call work.
- Low CSAT with strong operational metrics: Analyze customer effort, tone, policy friction, and whether the interaction resolved the need.
- Uneven results across locations: Check training consistency, call routing, system access, and local queue mix before comparing individuals.
Use call recordings and calibrated reviews to connect the metric to behavior. One supervisor's opinion shouldn't determine a quality score while another supervisor applies a different standard. Review the same rubric, discuss disagreements, and update examples when the process changes.
Managers can also use call-center coaching software to organize feedback, assign targeted practice, and keep coaching records tied to performance patterns. The tool matters less than the operating discipline. Every coaching action should have a reason, a behavior to change, and an outcome to monitor.
Give agents authority to resolve appropriate issues on the first contact. If policy forces routine escalations, no amount of motivational coaching will create stronger FCR. Fix the workflow, knowledge base, routing rules, or approval path that blocks resolution.
Building a Balanced Scorecard with SnapDial
A balanced scorecard starts with reliable event data, not a polished dashboard. Managers need queue activity, routing history, recordings, dispositions, wait times, transfers, and follow-up signals in a form that supports review without rebuilding each interaction by hand.
SnapDial is a cloud-based business phone system with contact-center capabilities that fit this operating model. Smart queue management, real-time statistics, callbacks, wait-time announcements, and reporting show both service conditions and agent activity. Call recording, visual voicemail with transcription, call logs, mobile routing, and a self-service web portal add context across the customer journey.
That context helps separate agent performance from queue conditions. A supervisor can see whether a caller waited, requested a callback, moved between queues, left voicemail, or reached an agent with the information needed to act. These records also support consistent quality reviews and comparisons across locations and hybrid teams.
Turn reports into operating routines
Use a fixed review cadence:
- Daily queue review: Check interval wait time, abandonment, occupancy, adherence, and staffing exceptions.
- Weekly agent review: Compare AHT, FCR, transfers, quality results, repeat contacts, and customer feedback within the same queue and complexity mix.
- Monthly system review: Examine routing problems, recurring knowledge gaps, automation failures, AI deflection results, and demand patterns that affect the scorecard.
- Quarterly metric review: Remove measures that do not change decisions and add measures needed for new channels or automation.
Use reporting to investigate, not to rank people mechanically. A dashboard should direct attention to calls and operating conditions that need action. Optimizing AHT alone can shorten interactions while increasing repeat contacts, transfers, or customer effort. Queue complexity and contacts resolved through automation also change the denominator, so managers should not treat every outcome as an individual agent result.
The strongest programs connect capacity with customer outcomes. They measure efficiency alongside resolution and quality, then evaluate AI deflection as part of the customer journey. If automation removes simple contacts, the remaining queue may require more judgment, making raw AHT comparisons especially misleading.
SnapDial combines cloud PBX functions with queue management, recordings, callbacks, real-time statistics, and reporting for teams that need a connected view of communication performance. Visit SnapDial to review how its phone and contact-center capabilities can support a scorecard built around resolution, quality, capacity, and customer outcomes.
If current reports cannot separate queue conditions from agent behavior, fix the reporting layer first. Audit whether the system can produce the four metric groups, then use interaction records to test which measures lead to better decisions.