
A customer calls your business, hears clipped syllables, asks the agent to repeat the answer, and then hangs up. Your team blames the headset. The office manager blames the internet. The carrier sees no obvious outage. By the end of the day, nobody can explain what happened, and the call disappears into a recording archive.
That gap is what call quality monitoring is designed to close. It connects what the customer heard with what the phone system, network, agent, and supervisor can measure. A useful program doesn't treat monitoring as a single dashboard or a pile of recordings. It combines human review of conversations with technical telemetry from the voice path, then turns both into decisions about coaching, routing, infrastructure, and customer experience.
What Call Quality Monitoring Really Means
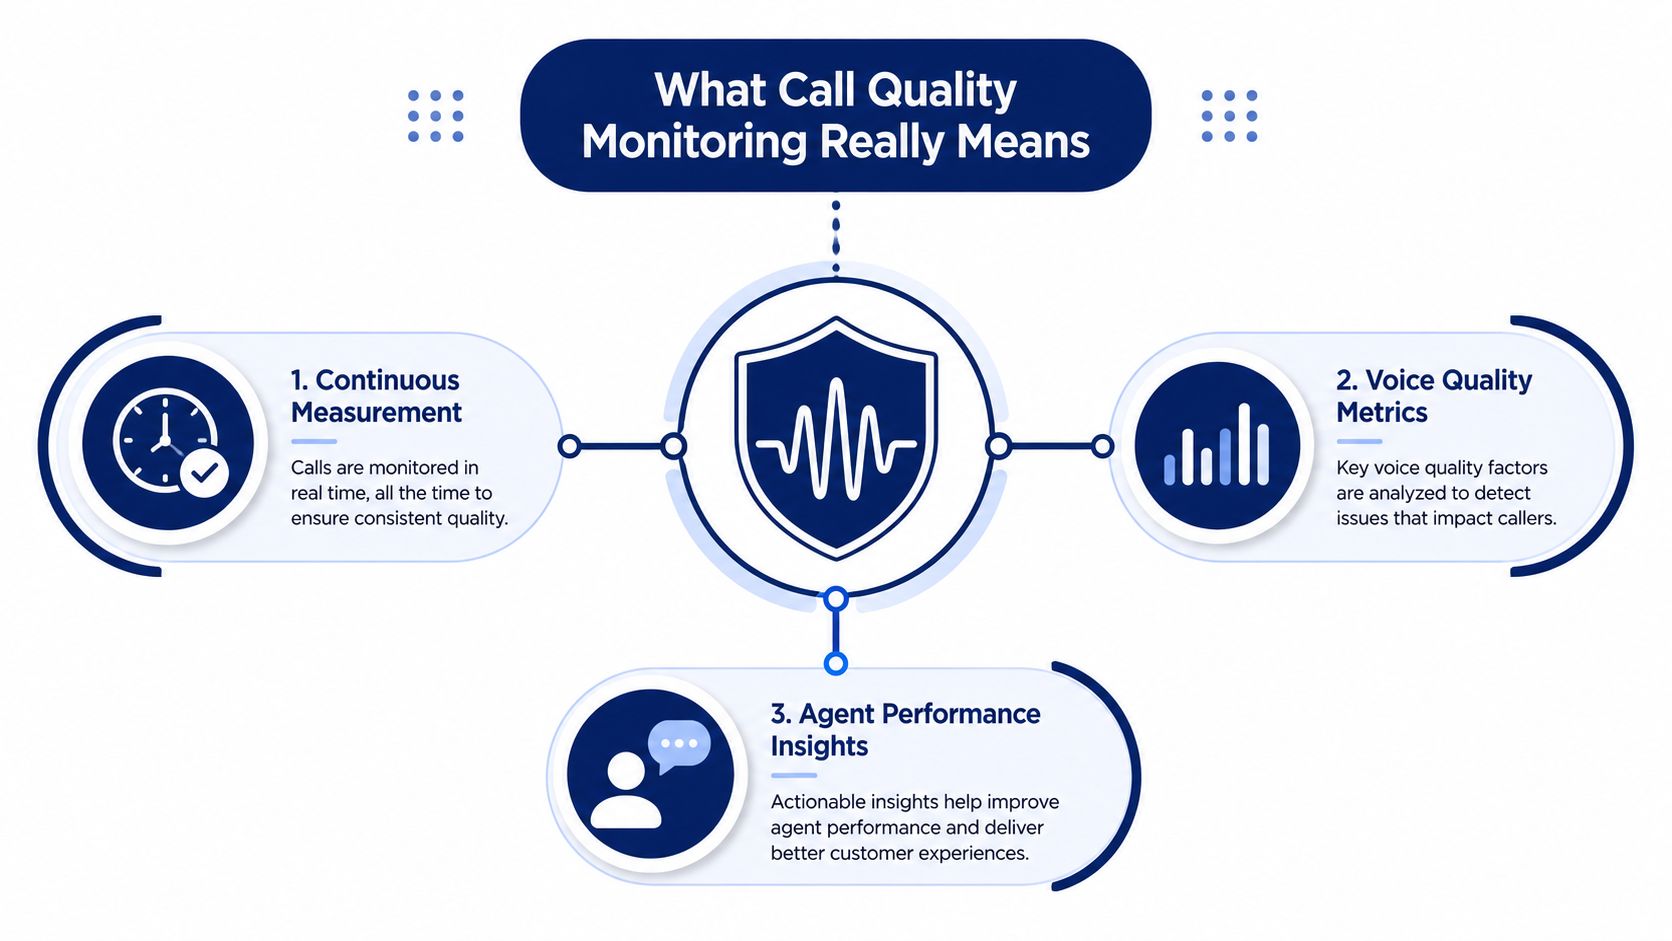
Call quality monitoring is the ongoing practice of measuring, scoring, and improving business conversations. It asks two different questions at the same time:
- Did the call sound clear and stable?
- Did the agent handle the interaction effectively?
Those questions overlap, but they aren't interchangeable. A call can have excellent audio and still fail because the agent transferred the customer repeatedly or gave an incomplete answer. Another call can be handled perfectly by a skilled employee, yet leave the customer frustrated because words were lost to packet loss or delay.
Think of the phone conversation as a delivery route. Network telemetry checks the road, including congestion, delay, and missing packets. Quality assurance checks the delivery, including whether the right information reached the customer and whether the agent followed the required process. You need both views to understand the result.
The four-part operating loop
A practical call quality monitoring program follows a simple loop:
- Listen to recordings, transcripts, or live conversations to understand the human experience.
- Measure network and call-handling signals for individual calls, users, locations, queues, and trunks.
- Score the interaction against a defined rubric, such as greeting, accuracy, resolution, compliance, and communication quality.
- Act through coaching, routing changes, network remediation, documentation updates, or escalation.
Manual QA remains valuable because a supervisor can hear context that a metric can't. The reviewer may notice that an agent technically followed the script but sounded uncertain, or that a customer became upset after a confusing transfer. Network data adds the other half of the explanation by showing whether the conversation suffered from jitter, loss, delay, or endpoint trouble.
Why the model changes by business size
An SMB replacing a legacy PBX usually needs visibility into users, devices, locations, and internet paths. A multi-site company needs comparisons between branches, because a problem affecting one office shouldn't trigger a redesign of the whole phone system. A contact center adds queues, agent scorecards, recordings, coaching workflows, and service measures such as resolution and transfer behavior.
The working definition is straightforward: call quality monitoring means listening to the experience, measuring the call, scoring what happened, and acting on the evidence. If a report doesn't lead to a network fix, a coaching conversation, or a process change, it may be collecting information without monitoring quality.
The Core Metrics That Define Audio and Service Quality
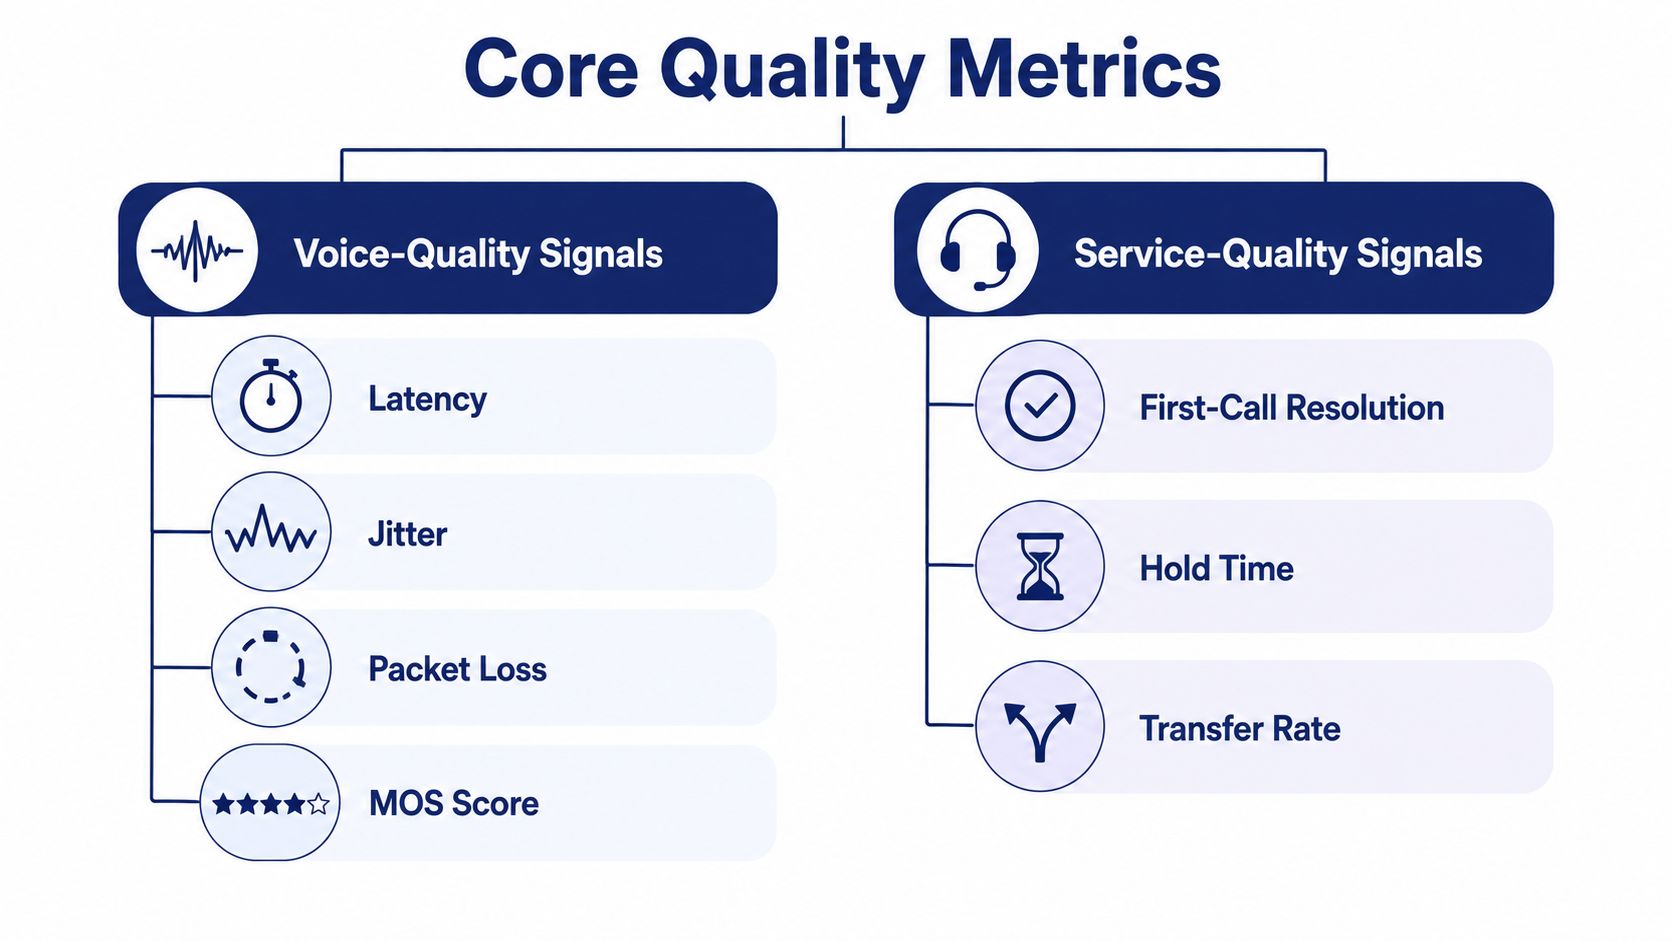
A monitoring dashboard becomes easier to read when you separate its signals into two families. Voice-quality metrics describe the sound path. Service-quality metrics describe the conversation and its outcome.
Voice quality signals
Mean Opinion Score, or MOS, summarizes perceived voice quality on a 1-to-5 scale. In enterprise VoIP monitoring, MOS is derived from the ITU-T E-model, G.107, and translates network impairments into a score that is easier for operations teams to understand. A score by itself isn't a diagnosis, though. Pair it with the underlying RTP and RTCP data.
- Packet loss means voice packets never arrive. The listener may hear clipped syllables, missing words, or short gaps. The distribution matters, too. Consecutive lost packets can sound worse than the same overall loss rate spread evenly through the call.
- Jitter means packets arrive at uneven times. The listener experiences this like a stutter or an unstable rhythm. A concise explanation of the underlying networking concept appears in this guide to what jitter means in networking.
- Latency is the one-way or round-trip delay between speakers. High delay makes people talk over one another because each person waits too long to hear the other respond.
- Codec and packetization affect how voice is encoded and delivered. They should be reviewed alongside loss, jitter-buffer behavior, and delay rather than treated as isolated configuration choices.
A useful analogy is a live interpreter. Packet loss removes words, jitter makes delivery uneven, and latency makes the interpreter slow to respond. MOS tells you how damaging the combined experience may be, while the impairment metrics help you find the cause.
Service quality signals
The conversation needs its own scorecard. First-Call Resolution, or FCR, asks whether the customer got the issue resolved in one interaction. Average Handle Time shows how long the interaction takes, but it shouldn't be judged alone. A short call may end quickly because the agent solved the problem, or because the customer gave up.
Other useful signals include:
- Silence ratio, which can reveal searching, uncertainty, system friction, or a customer waiting without explanation.
- Transfer count, which highlights routing problems and ownership gaps.
- Hold time, which shows how long the customer waits while the agent seeks help or accesses information.
- Customer Satisfaction, collected through surveys or conversation analysis where the platform supports it.
- Compliance and rubric adherence, which confirm that the agent followed required disclosures, verification, and resolution behaviors.
Operational rule: Never celebrate a good MOS score if FCR, transfers, silence, or customer feedback show that the interaction still failed.
The reverse is also true. A strong FCR result doesn't prove the phone system worked well. Review audio metrics beside service metrics so managers can distinguish a training issue from a network issue. That distinction determines whether the next action belongs to a coach, an office administrator, a carrier, or an IT technician.
Why Traditional Call Monitoring Falls Short at Scale
A supervisor reviews a few calls at the end of the week. Those recordings may reveal a missed disclosure or a difficult escalation, yet the queue could have handled hundreds of other conversations with no direct review. For roughly two decades, contact-center QA relied on this manual sampling model. A quality team typically reviewed only 1% to 3% of customer interactions, scored them against a rubric, and shared feedback later, often through weekly coaching cycles, as described in Verint's call quality monitoring guidance.
The model reflected a real capacity limit. Human reviewers could not listen to every conversation, so the selected calls became the organization's working picture of quality. Recent industry guidance indicates that some centers still review only 1% to 2% of calls. That leaves leaders making decisions from a narrow slice of activity, even when the remaining calls contain recurring problems.
The bias inside a small sample
Small samples can overrepresent unusual interactions. A supervisor might choose a difficult escalation, an agent-flagged call, or a conversation from one queue. Those calls deserve attention, but they may not represent routine performance across teams, locations, shifts, or customer types.
The model also introduces a feedback delay. An agent may receive coaching days later, after the conversation details have faded and the same behavior has appeared in many more calls. Supervisors then have to determine whether a low score reflects a repeatable pattern or a one-off event.
A 2022 global contact-center QA benchmark found that 74% of executives said their organizations measure all three key QA metrics used in their programs. The research also reported that 95% of call centers use call monitoring and coaching to improve customer service, as documented in the 2022 global quality assurance benchmark. Formal QA is established, but broad adoption does not solve limited coverage.
What modern telemetry changes
Modern VoIP platforms can attach technical evidence to every call record instead of relying only on selected recordings. Microsoft's Call Quality Dashboard, for example, makes records available within about 30 minutes after a call ends and retains them for 12 months. That supports faster investigation and comparison across time, users, devices, locations, and routes.
AI-assisted scoring can widen review coverage and apply a rubric more consistently. It still requires governance. Teams must define meaningful behaviors, compare automated results with human review, explain scores to agents, and protect sensitive recordings and transcripts.
The practical shift: Use automation to widen the lens, then use people to interpret patterns and coach responsibly.
An SMB can combine VoIP telemetry with transcription, recording review, and structured scorecards without building a large QA department. The operating model should connect the legacy sampled review to near-real-time signals. Telemetry identifies where to look, while human review explains what happened and what action fits.
That advantage depends on clear boundaries. Define the monitoring purpose, access rules, retention practices, and appeal paths before expanding coverage. Treat monitoring as an operating instrument, not constant surveillance.

Passive Monitoring Versus Active Testing Versus Live Coaching
A customer reports broken audio, yet the network dashboard looks normal. The explanation may be that no one measured the affected route at the right time, or that the dashboard showed infrastructure health without revealing the agent's experience. Passive monitoring, active testing, and live coaching address different parts of that problem. Using only one leaves a gap.
Passive monitoring observes real calls and connects call metadata with RTP or RTCP telemetry. It can associate quality signals with users, devices, locations, trunks, codecs, and time periods. The key question is, “What happened on actual customer calls?” This approach can expose recurring packet loss at one branch or audio degradation in a queue during busy periods.
Its evidence comes from live traffic, so it cannot confirm that a route is healthy when nobody is calling. It may also show that a call was poor without identifying whether the office network, endpoint, carrier route, or remote worker's connection caused the fault. Analysts need correlation with other records to narrow the source.
Active testing uses synthetic calls, probe devices, or test numbers to create predictable traffic. It asks, “Can this route complete a controlled call right now?” That makes it useful for branches, trunks, and checks outside business hours. A business can use a test number to call in a controlled validation routine, then compare the result with telemetry from real calls.
Live coaching works inside the conversation. A supervisor can listen, whisper guidance to an agent, or intervene when a call needs immediate support. This can prevent an avoidable error before the customer leaves, but it depends on supervisor availability, clear intervention rules, and a culture that treats coaching as support rather than punishment.
Choose the combination that matches the operation
An SMB replacing a legacy PBX can start with passive monitoring and periodic synthetic tests. The first layer samples actual customer experiences, while the second checks important paths when call volume is low. This bridges the older manual QA model, often based on reviewing a small sample of recordings, with near-real-time VoIP telemetry that can flag where review should begin.
A multi-site company should place active tests at each branch. If one location reports poor audio, a controlled call can help establish whether the problem is local before staff alter shared services or carrier settings.
A contact center should add live coaching after baseline measurements are reliable. Supervisors need enough context to separate an agent behavior issue from a network issue. Otherwise, they may give inconsistent instructions or coach an employee for a fault outside their control.
| Approach | What It Catches | Typical Cost | Best Fit |
|---|---|---|---|
| Passive monitoring | Real-call impairments, user patterns, trunk and location trends | Usually built into the VoIP or contact-center platform, with setup and reporting effort | SMBs and teams that need broad visibility into live traffic |
| Active synthetic testing | Route failures, branch-specific problems, recurring path degradation outside busy periods | Probe devices, test numbers, and ongoing test administration | Multi-site companies and critical voice paths |
| Live coaching | Agent behavior, compliance risks, escalation handling, and recoverable issues during a call | Supervisor time, training, and live-monitoring capability | Contact centers with established scorecards and coaching workflows |
The strongest operating model uses all three layers. Passive data identifies where to inspect, active tests help isolate the path, and live coaching addresses the human interaction. Human review still explains the customer impact and determines the appropriate action.
Implementing Call Quality Monitoring on Hosted VoIP and Cloud PBX
A hosted VoIP rollout should make quality evidence visible without forcing the office administrator to become a telecom engineer. Start by enabling call detail records, recordings where appropriate, transcripts, and available quality metrics inside the phone platform. Make sure each record can be tied to a user, device, queue, location, and customer or ticket record.

Build the evidence path
The dashboard should answer three levels of questions:
- User level: Is one headset, handset, softphone, or remote connection producing poor calls?
- Site level: Do several employees at the same branch show the same pattern?
- Service level: Is the issue concentrated on a trunk, queue, route, or codec path?
Integrate the phone system with the CRM and ticketing platform so recordings, transcripts, call outcomes, and quality notes appear beside the customer history. A score that lives in a separate portal is easy to overlook. A score connected to the account and support case can guide the next action.
SnapDial provides a practical example of this hosted model, with real-time statistics, detailed reporting, smart queue management, call recording with transcription, and visual voicemail. Its self-service web portal lets administrators manage users, routing, voicemails, call logs, and recordings without depending on a separate on-premises PBX interface.
Use the platform's reporting features to establish a baseline before changing network settings. For broader context on replacing a traditional phone system, the Finchum Fixes IT PBX guide offers a separate implementation perspective for businesses evaluating PBX and VoIP choices.
A rollout also needs ownership. Decide who reviews live alerts, who handles network investigation, who coaches agents, and who approves access to recordings and transcripts. SnapDial's 24/7 Texas support center and white-glove setup model can reduce the burden for an SMB that doesn't have dedicated voice operations staff.
Use the following video as a visual reference for the hosted phone-system environment and administration workflow.
Keep the reporting cadence simple at first. Supervisors need immediate exceptions, managers need trends by user and location, and executives need a concise view of recurring customer-impacting issues. Don't collect every available metric until someone knows what decision each metric will support.
Alerting Thresholds and Reporting Templates That Drive Action
An alert becomes useful only when it points to a response. Thresholds should distinguish a warning from a severe event, then add context such as duration, recurrence, affected users, and loss-burst behavior.
Packet loss becomes audible around the 1% range, while sustained loss above roughly 3% is commonly treated as severe degradation. Jitter above about 30 to 40 milliseconds can justify a watch alert, and MOS below approximately 3.5 to 3.8 often deserves investigation or a coaching review. These field thresholds are summarized in the VoIP MOS score guide.
| Metric | Watch Threshold | Severe Threshold | Likely Symptom |
|---|---|---|---|
| Packet loss | Around 1% | Sustained above roughly 3% | Clipped syllables, missing words, gaps |
| Jitter | Above about 30 to 40 ms | Persistent instability with degraded MOS | Stutter, late packets, uneven speech |
| MOS | Below about 3.5 to 3.8 | Recurring periods below 3.8 | Noticeably poor voice quality and complaints |
| Latency | Rising trend or repeated delay | Conversation becomes difficult to manage | Talk-over, delayed responses, awkward turns |
| FCR | Downward trend alongside repeat contacts | Persistent failure to resolve in one interaction | More callbacks, transfers, and customer effort |
Average loss can hide the experience. A short burst of consecutive loss may damage speech more than the same rate distributed evenly, so alert rules should preserve per-call detail and not rely only on a trunk average.
Match the report to the decision-maker
A supervisor wallboard should show current queue status, active calls, exceptions, and agents who need immediate assistance. A weekly manager report should group recurring issues by agent, location, device, route, and queue, then connect quality findings with FCR, transfers, silence, and hold behavior.
A monthly executive summary should stay focused on business impact. It can show whether recurring audio problems are declining, whether unresolved calls are concentrated in a process or location, and which remediation work needs funding. The call-center dashboards resource provides a useful reference point for organizing real-time and historical views.
Reporting discipline: Every alert should have an owner, an investigation window, and a documented disposition.
Don't page a manager for every isolated dip. Escalate repeated threshold breaches, clusters affecting multiple users, and patterns that align with customer complaints. That approach protects the team from alert fatigue while preserving evidence for network-path inspection, QoS verification, or codec and packetization review.
Troubleshooting Playbook and ROI Examples for SMBs and Contact Centers
A professional services firm with a small office notices that calls sound worse on Fridays. Passive monitoring shows MOS dips clustered by time and location rather than by one employee. The operations lead compares device and network records, finds shared Wi-Fi contention during the busy period, segments voice traffic, and reviews codec settings. The lesson isn't the specific fix. It's the sequence, detect the pattern, isolate the scope, change one variable, and confirm the result with new calls.
A contact center sees repeat contacts rising even though agent scripts appear compliant. Managers compare FCR with silence ratio, transfer behavior, and transcripts. They find that agents pause while searching for policy answers, then transfer customers when the first explanation fails. Coaching focuses on knowledge access and ownership, not just speed.
The ROI case usually comes from several smaller gains rather than one dramatic metric. Monitoring can help the business:
- Reduce avoidable churn risk by identifying recurring audio failures and poor interactions.
- Shorten troubleshooting time by linking complaints to users, sites, trunks, and routes.
- Improve coaching focus by directing supervisors toward repeated behaviors instead of random recordings.
- Protect customer effort by finding transfer, hold, and resolution problems earlier.
Track whether alerts receive timely investigation, whether recurring faults are isolated more quickly, whether coaching actions are documented, and whether FCR, transfer, silence, and customer feedback trends become easier to explain over the first 90 days. AI-assisted monitoring is expanding toward real-time guidance, automated scoring, and cross-channel standardization. One 2025 projection says that more than 60% of enterprise quality monitoring systems will incorporate generative AI capabilities by 2025, according to Callin's quality monitoring coverage. Treat that as a projection, not a guarantee, and design privacy, access, retention, scoring validation, and human review into the program before expanding automation.
SnapDial combines hosted VoIP and Cloud PBX capabilities with call recording, transcription, queue management, real-time statistics, detailed reporting, and a self-service administration portal. Visit SnapDial to assess whether its monitoring features and 24/7 support model fit your SMB, multi-site operation, or contact center.